
Hive already tells you what your GraphQL API is doing: every operation, its error rate, and its latency, all in Usage Insights. Today we’re adding the piece that tells you the moment something goes wrong: Metric Alerts.
Metric Alerts continuously watch your GraphQL API’s live operational metrics and notify you (in Slack, MS Teams, or a webhook) as soon as they cross a threshold you define. No more finding out about a latency regression or an error spike from your users first.
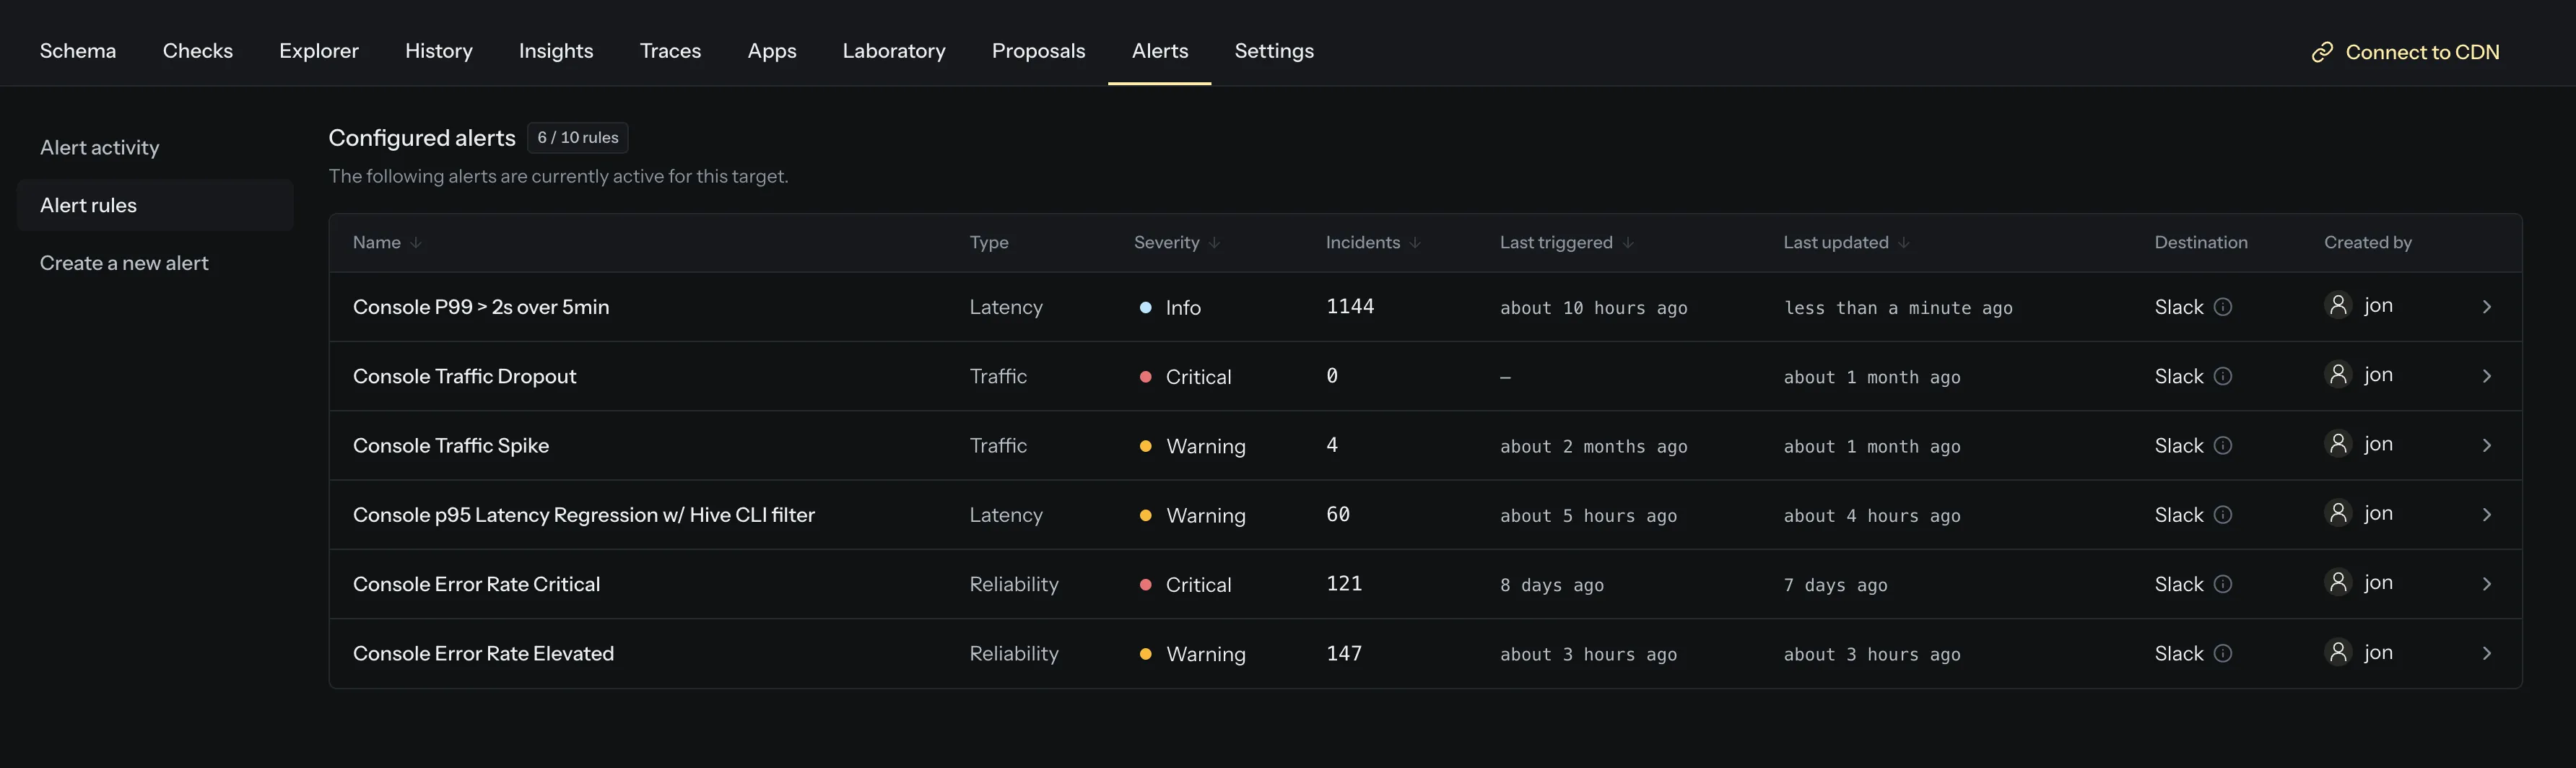
Alert on the metrics that matter
Create a rule in a few clicks and point it at any of your key metrics:
- Total requests: catch traffic drops (a deployment that broke a client) or unexpected surges.
- Error rate: know immediately when errors climb above an acceptable level.
- Latency: alert on p75, p90, p95, or p99 latency to stay ahead of performance regressions.
Each rule watches its metric over a rolling range, anywhere from 1 minute up to 7 days, and fires when your condition is met.
Fixed thresholds or relative change
Thresholds come in two flavors:
- Fixed value: “error rate above 5%” or “p95 latency above 500ms”.
- % change vs. previous: compare the current window to the one before it and fire on a swing, like “traffic dropped 50% compared to the previous hour”.
Add a hold period so brief spikes that clear on their own don’t page you, tag each rule with an Info / Warning / Critical severity, and, with saved filters, scope an alert to a specific set of operations or clients.
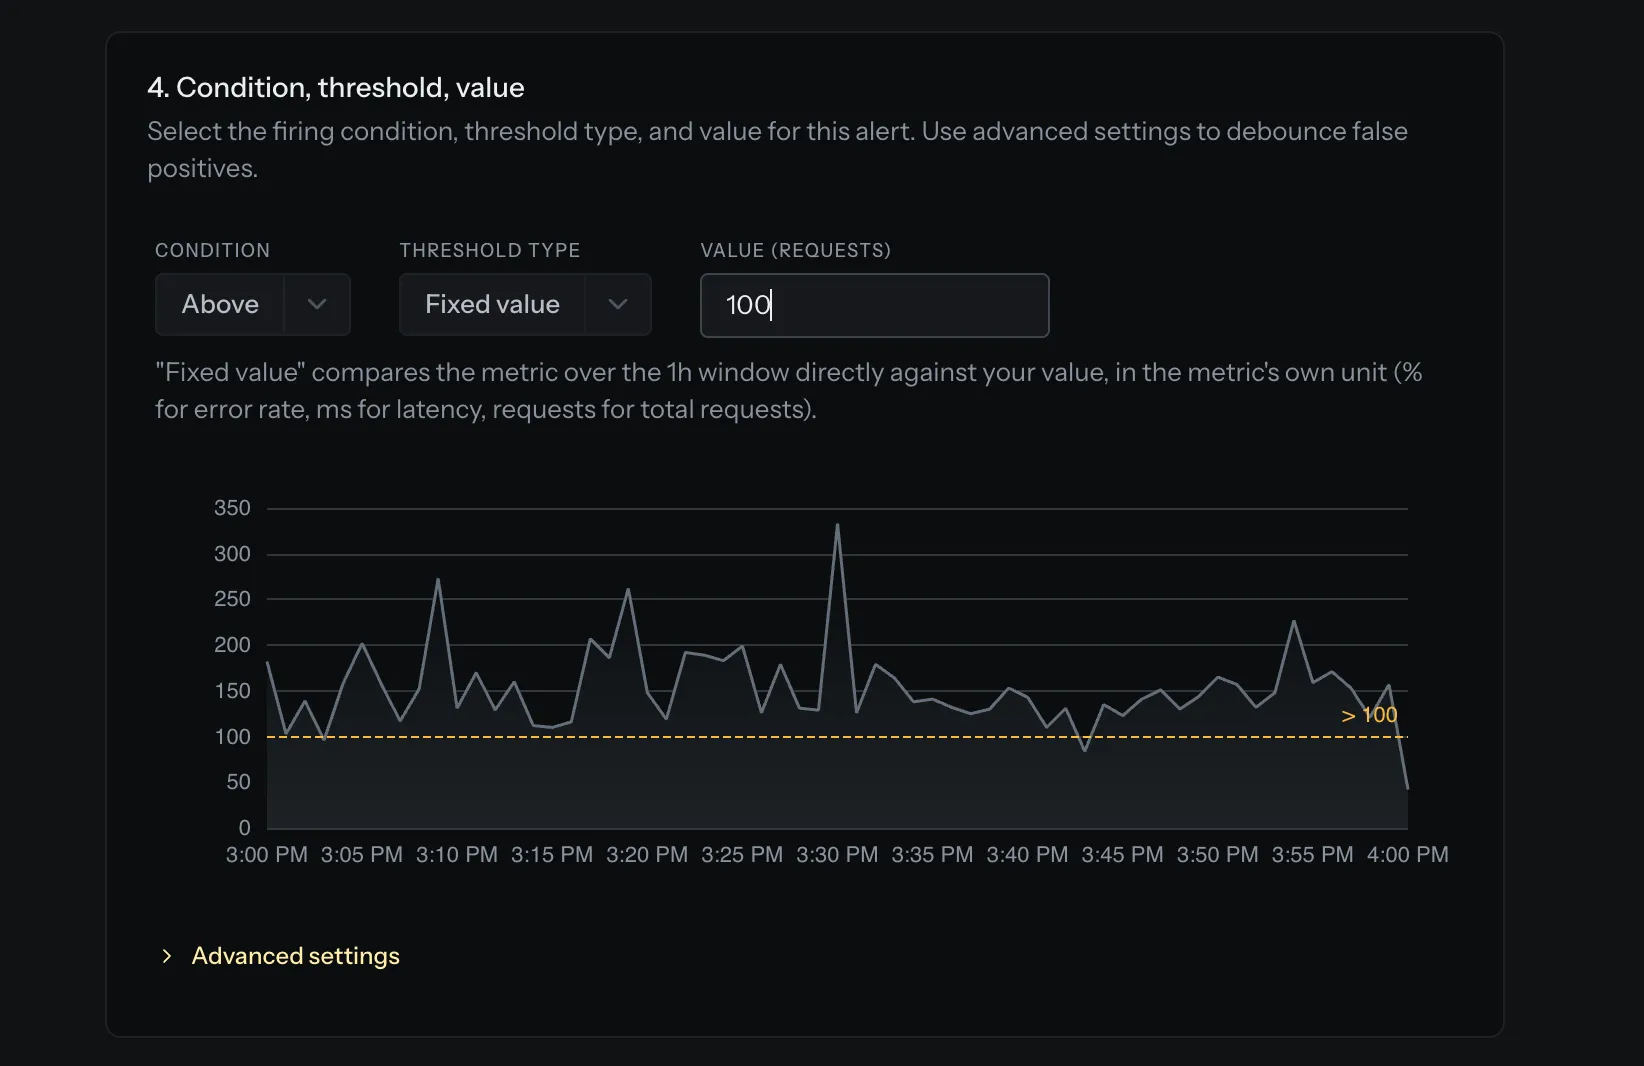
Notifications only when it counts
Every rule moves through a clear lifecycle (Normal → Pending → Firing → Recovering), and Hive only notifies you on the transitions that matter: when an alert starts firing and when it recovers. Firing episodes are grouped into incidents, and the Alert activity feed gives you a full timeline of every state change across the API.
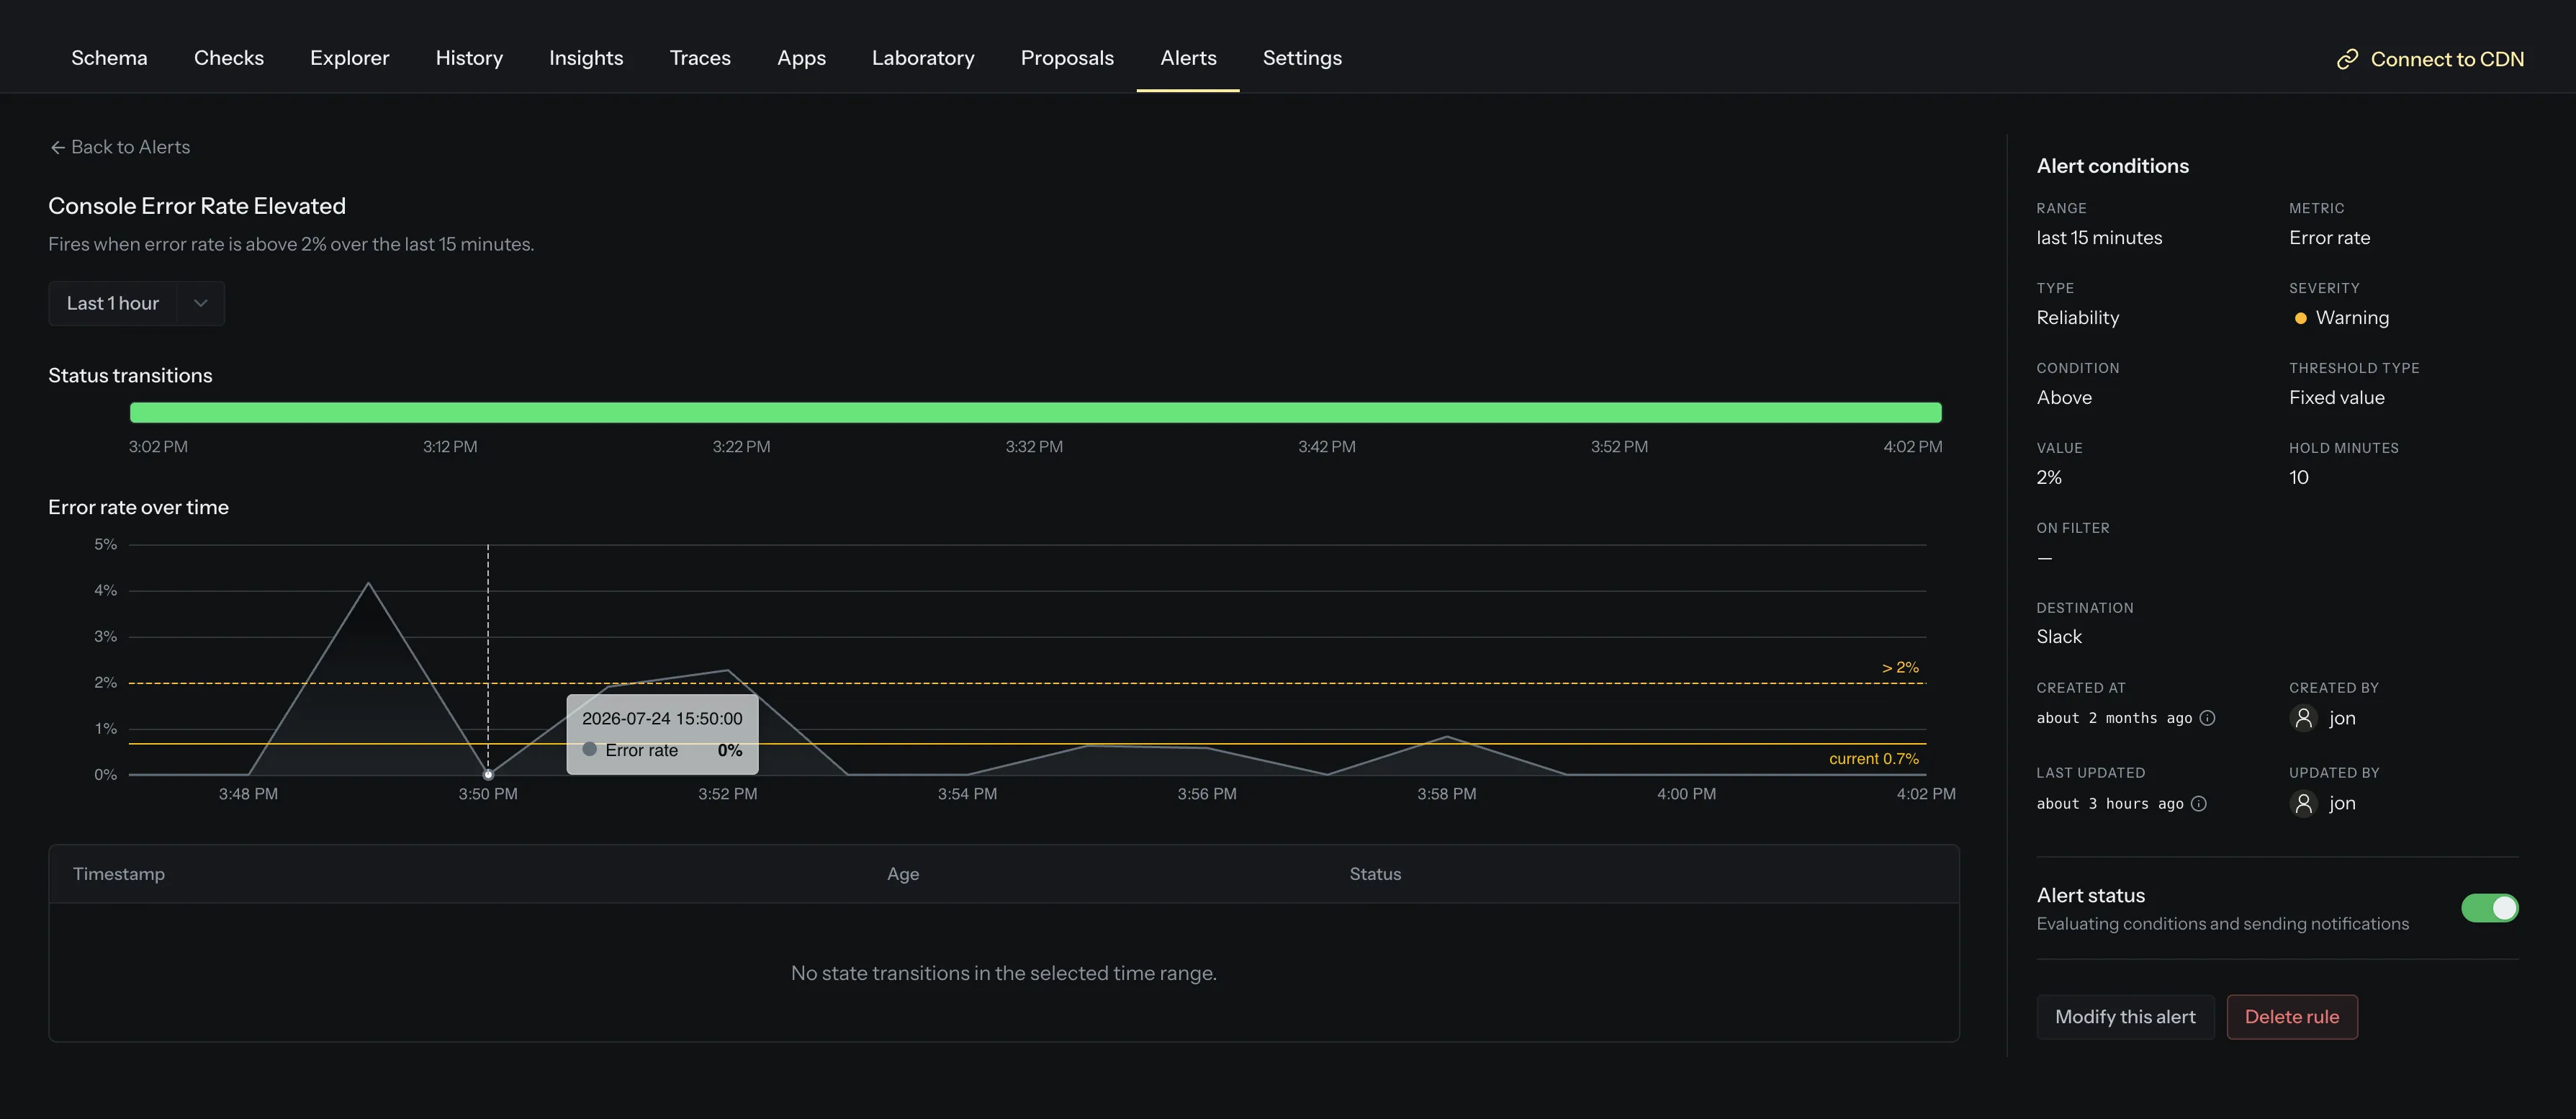
Metric Alerts reuse the Slack, MS Teams, and webhook channels you’ve already set up, and a single rule can notify several destinations at once. Prefer to watch before you wire up paging? Leave the destinations empty and the rule still tracks its state in the UI, a handy test mode.
Get started
Open any target, head to the Alerts section, and create your first rule. For the full details (metrics, conditions, the alert lifecycle, the webhook payload, and limits) see the Metric Alerts documentation.