GraphQL Schema Usage Insights
Hive allow you to collect usage data from your GraphQL operations and use the data collected for the following purposes:
- Monitoring and Observability: view a list of all your GraphQL operations and their performance, error-rate, and other metrics.
- Schema Usage and Coverage: understand how your consumers are using your GraphQL schema, and what parts of the schema are not being used at all (see Schema Explorer).
- Schema Evolution: with the knowledge of what GraphQL fields are being used, you can confidently evolve your schema without breaking your consumers (see Conditional Breaking Changes).
How it works
To collect and report usage information from your GraphQL gateway, you'll need to setup Hive Client within your GraphQL gateway, and have the metadata of your traffic reported to Hive.
Hive does not collect, process or store any data from your GraphQL operations or responses. Hive Client only transmits the metadata of your GraphQL operations to Hive: what fields were used, if there were any errors, etc.
The following information is included in usage reporting:
- Operation Name: the name of the operation, if it exists.
- Operation Type: the type of the operation (
query,mutation, orsubscription). - Coordinated: a simple array-based structure that represents what fields, arguments, and types
were used in the operation (for example:
Query.user,Query.user.idUser). - Client Identifier: the identifier of the client that sent the operation. This is useful to understand the distribution of your consumers.
- Date: the date and time when the operation was executed.
For additional reading, please refer to the following resources:
Monitoring and Observability
Once you have usage reporting enabled, and shipped your usage reports to Hive, you can view the usage data in the target's Insights page.
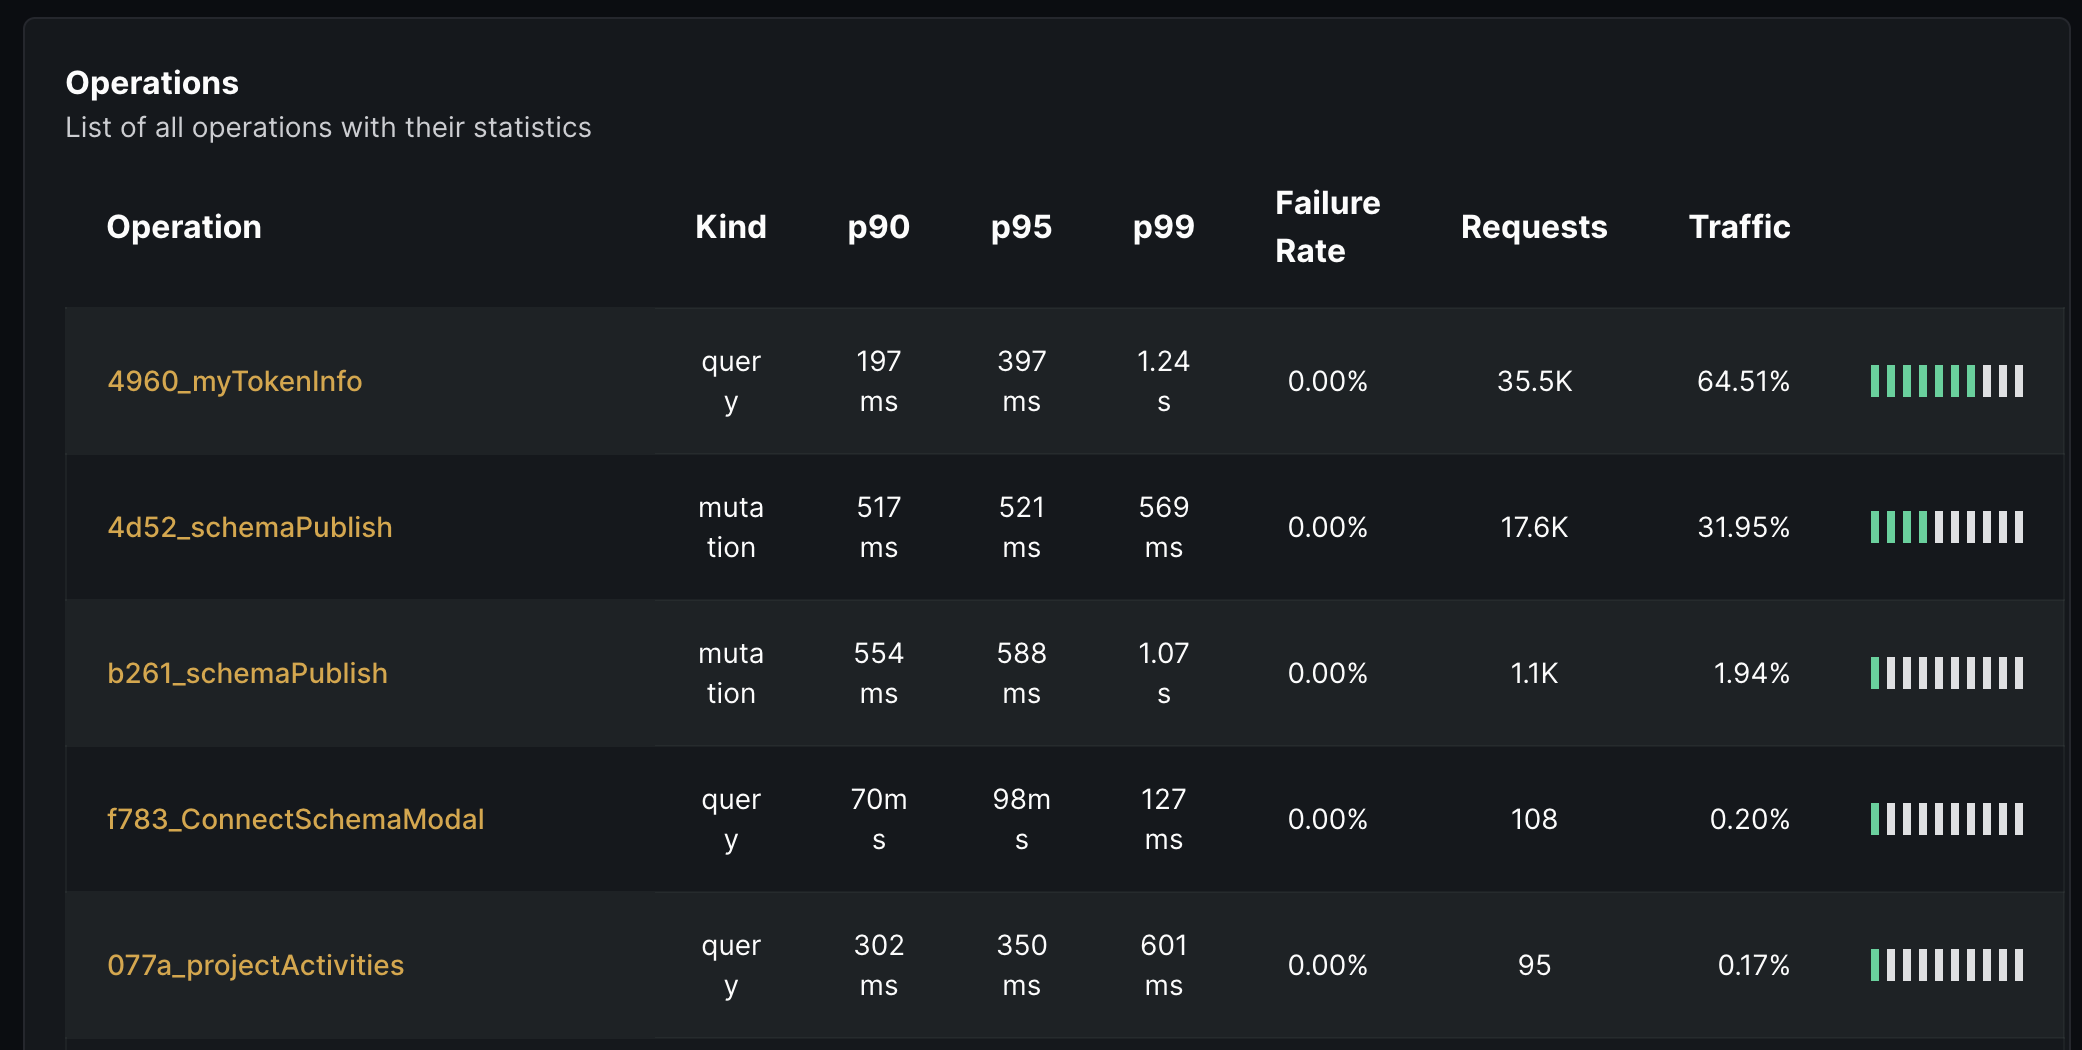
Hive Insights shows a list of all the GraphQL operations executed by your consumers and their performance metrics. This can be used to easily find outlying operations that may be slow or that have an unacceptable error rate.
By clicking on a specific query, you'll be able to see the full list of fields and arguments used in the operation.
Usage Statistics
From Insights, you'll be able to see the following metrics of your GraphQL API:
- Total amount of GraphQL executed.
- Average RPM (Requests Per Minute)
- Total count of unique GraphQL operations
- Success-rate of the executed operations
- Error-rate of the executed operations
- Latency (
p99,p95andp90)

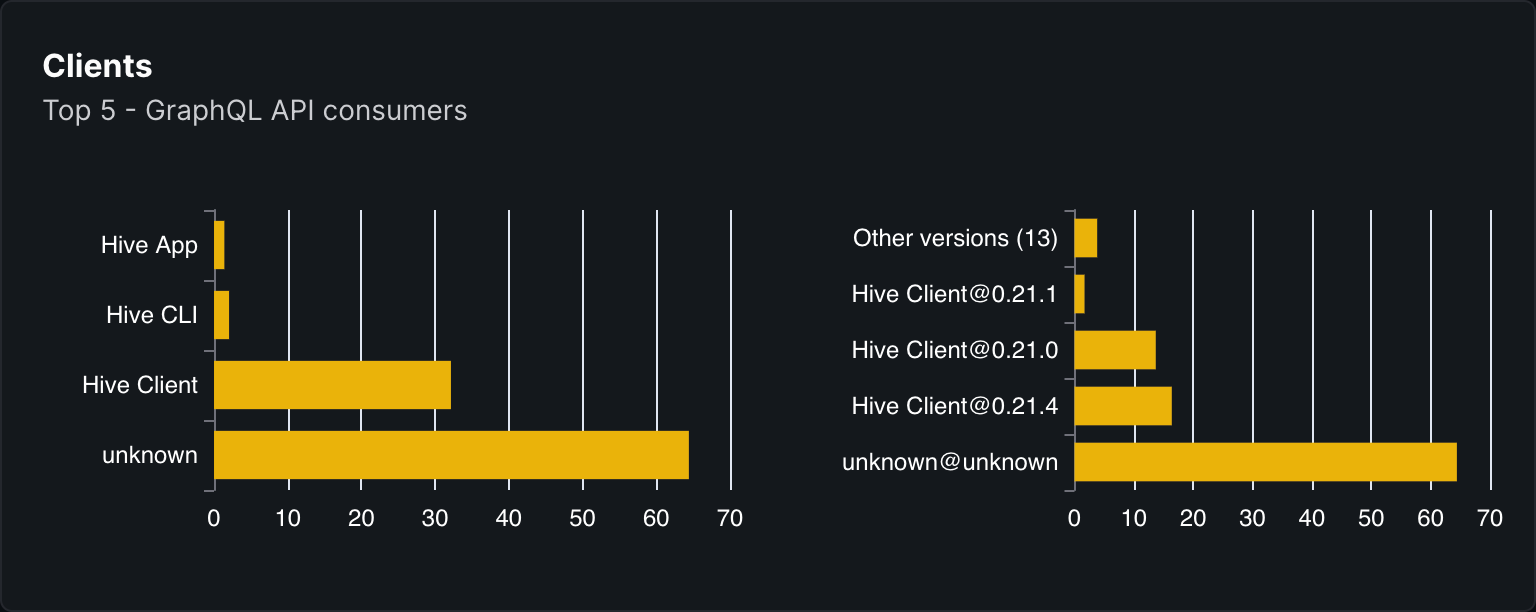
Clients Overview
A breakdown of the clients who are using your GraphQL gateway, and the amount of operations executed by each client.
Monitoring Statistics
A various of the charts and metrics useful for monitoring and having an overview of your GraphQL API performance:
- Operations time: the amount of GraphQL operations executed over time.
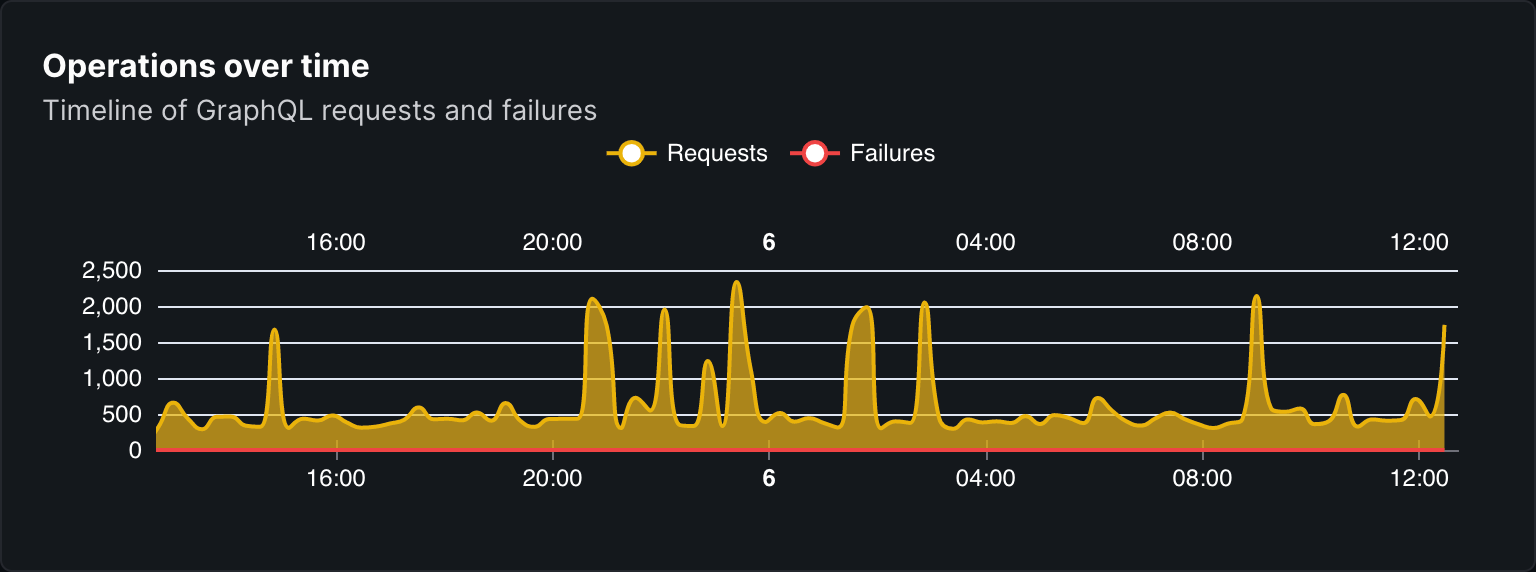
- RPM over time: the amount of GraphQL operations executed per minute over time.
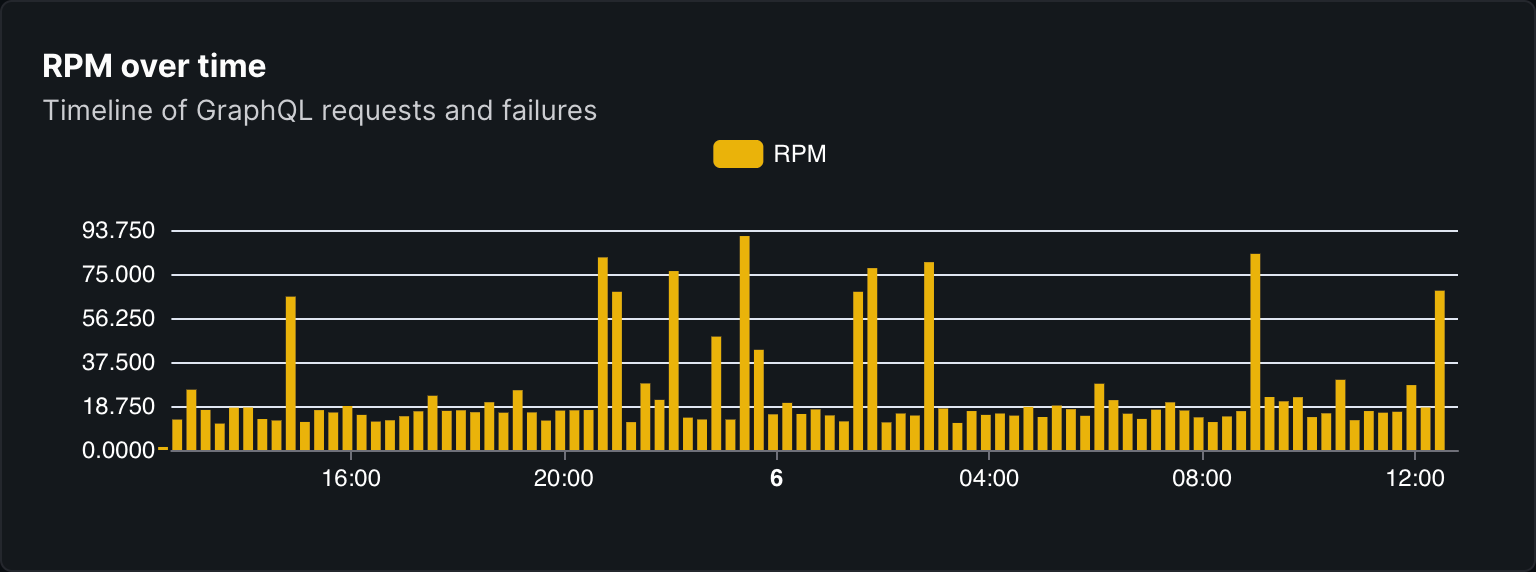
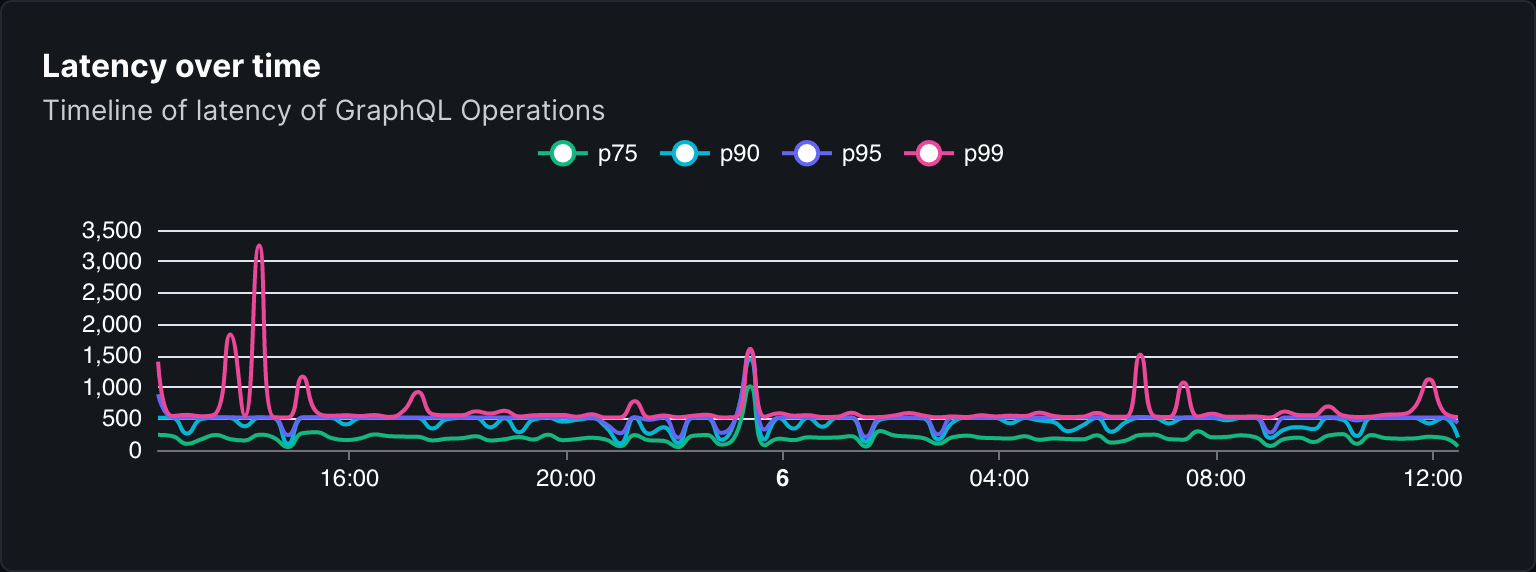
- Latency over time: the latency of GraphQL operations over time.
