Metric Alerts
Metric Alerts let you watch your GraphQL API’s live operational metrics (traffic, error rate, and latency) and get notified the moment they cross a threshold you care about. Instead of finding out about a latency regression or an error spike from your users, Hive evaluates your rules continuously and pushes a notification to Slack, MS Teams, or a webhook when something breaches.
Metric Alerts are configured and managed per target, from its Alerts section. They complement, but are separate from, schema-change alerts and notifications, which are configured at the project level and fire when a schema is published.
Overview
A metric alert rule answers a single question, for example “Is p95 latency above 500ms over the last 5 minutes?” Each rule combines:
- A metric to watch: total requests, error rate, or a latency percentile.
- A range, the rolling time window the metric is measured over.
- A condition: the threshold, the threshold type, and the direction that counts as a breach.
- A severity: Info, Warning, or Critical.
- Destinations, the alert channels a notification is sent to when the rule fires and recovers.
Hive re-evaluates every rule on a rolling schedule and moves it through a small set of states. You only receive notifications on meaningful transitions, when a rule starts firing and when it recovers, so a brief spike that clears on its own won’t page you unless you want it to.
Alert states and lifecycle
Once a rule is enabled, Hive evaluates it continuously and moves it through the following states:
| State | Meaning |
|---|---|
| Normal | The metric is within the threshold. Nothing to do. |
| Pending | The threshold is breached, but the hold period hasn’t elapsed yet. |
| Firing | The breach was confirmed. An incident is open and notifications are sent. |
| Recovering | The metric is back within the threshold, waiting out the hold period to clear. |
Notifications are sent on exactly two transitions:
- Pending → Firing: the alert has triggered. A firing notification is sent to every destination and an incident is opened.
- Recovering → Normal: the alert has recovered. A resolved notification is sent and the incident is closed.
A breach that clears before the hold period elapses returns to Normal as a false alarm and never notifies. If a recovering alert breaches again before it clears, it re-attaches to the still-open incident rather than opening a new one.
Evaluation cadence scales with the range: rules on windows of an hour or less are checked roughly every minute, while longer windows are checked less often. Alerts in a pending or recovering state are always re-checked on every tick so state changes aren’t delayed.
Activity and incidents
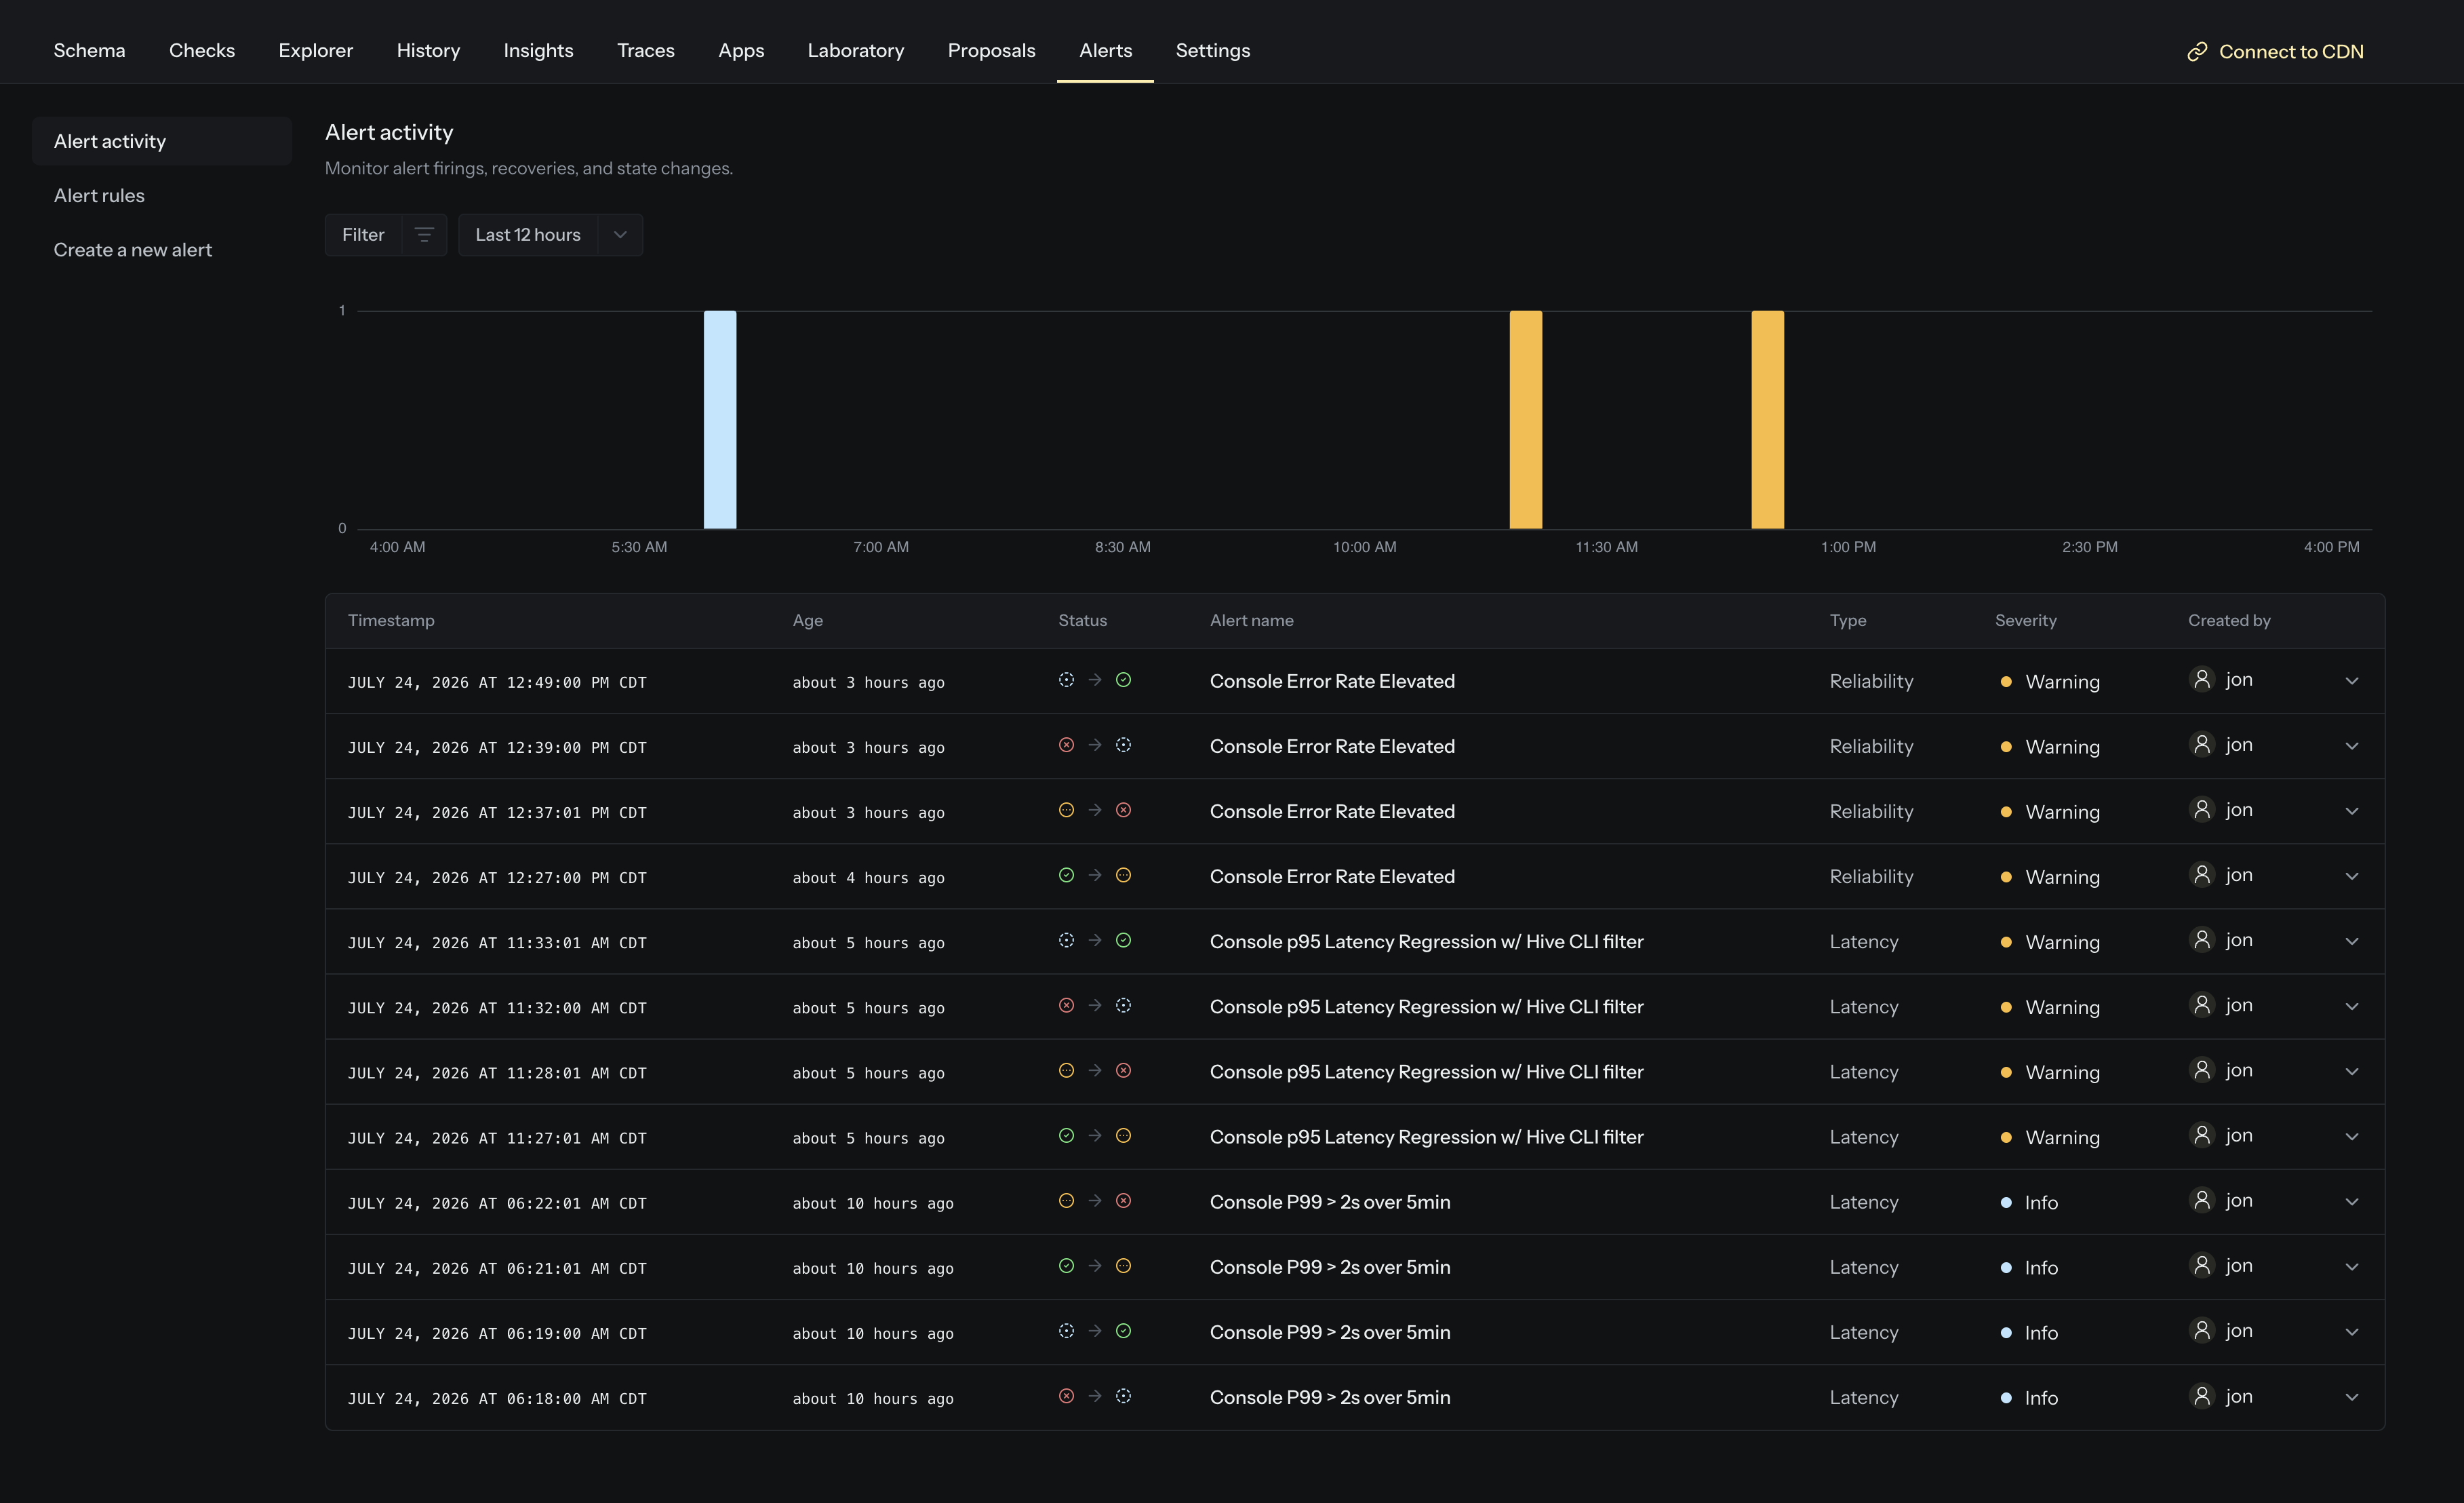
The Alert activity tab is the timeline of every state change across your API’s rules: firings, recoveries, and the transitions in between. You can filter it by severity, type, and who created the rule.
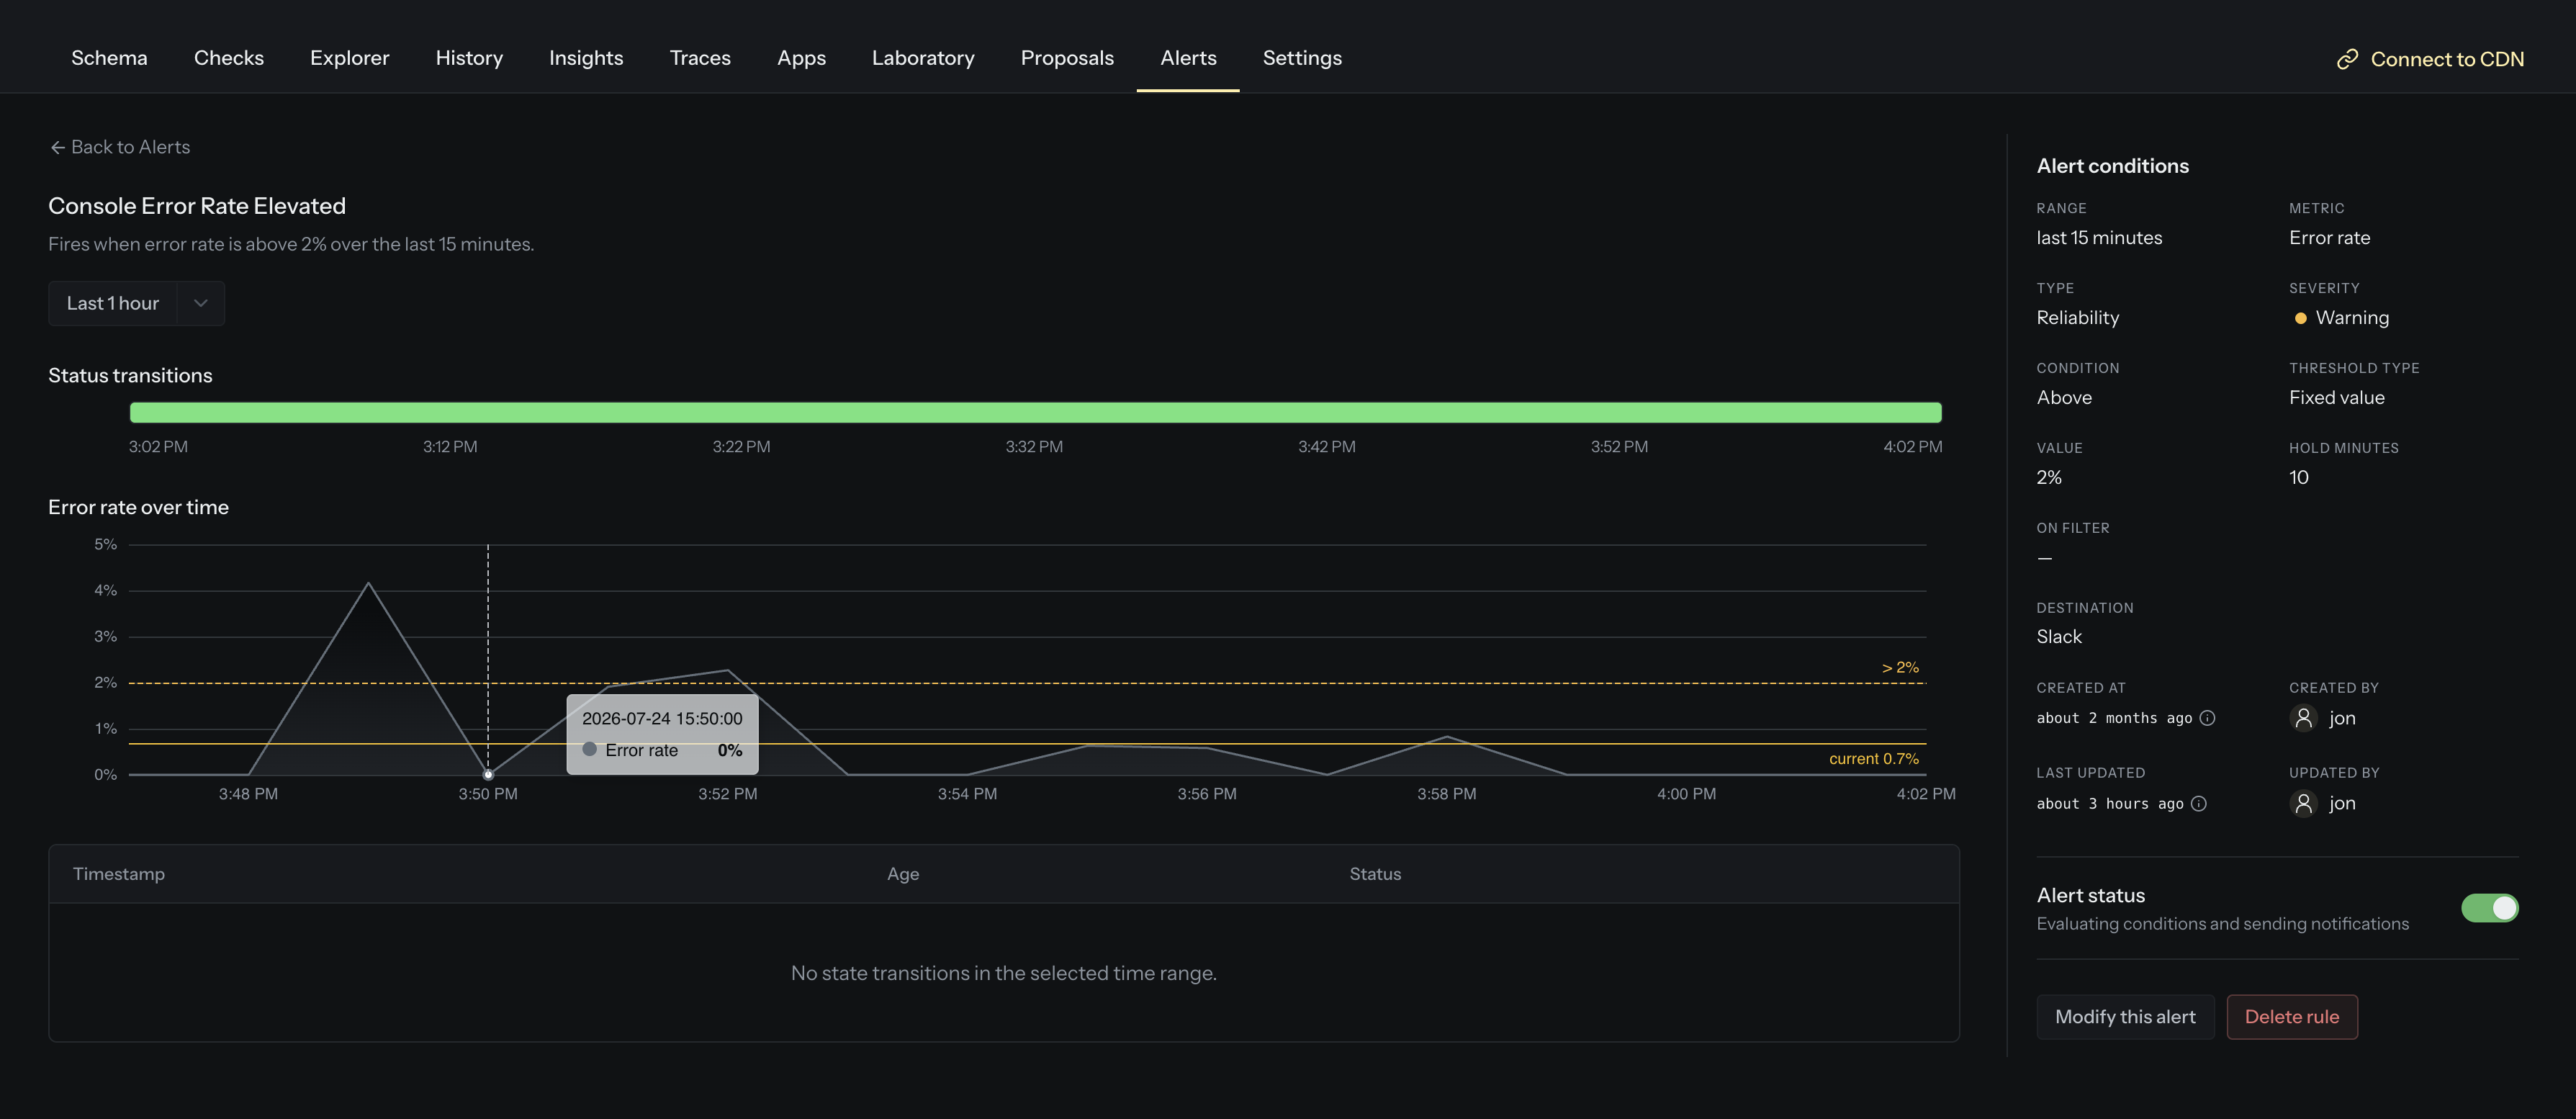
Open any rule to see its detail page: a status-transition timeline, a chart of the underlying metric over time, and the full list of state-change events. An incident groups everything from the moment a rule started firing until it recovered.
Managing alert rules
Open your target and go to the Alert rules tab. This lists every metric alert configured for your API, with its type, severity, incident count, when it last triggered, and its destinations.
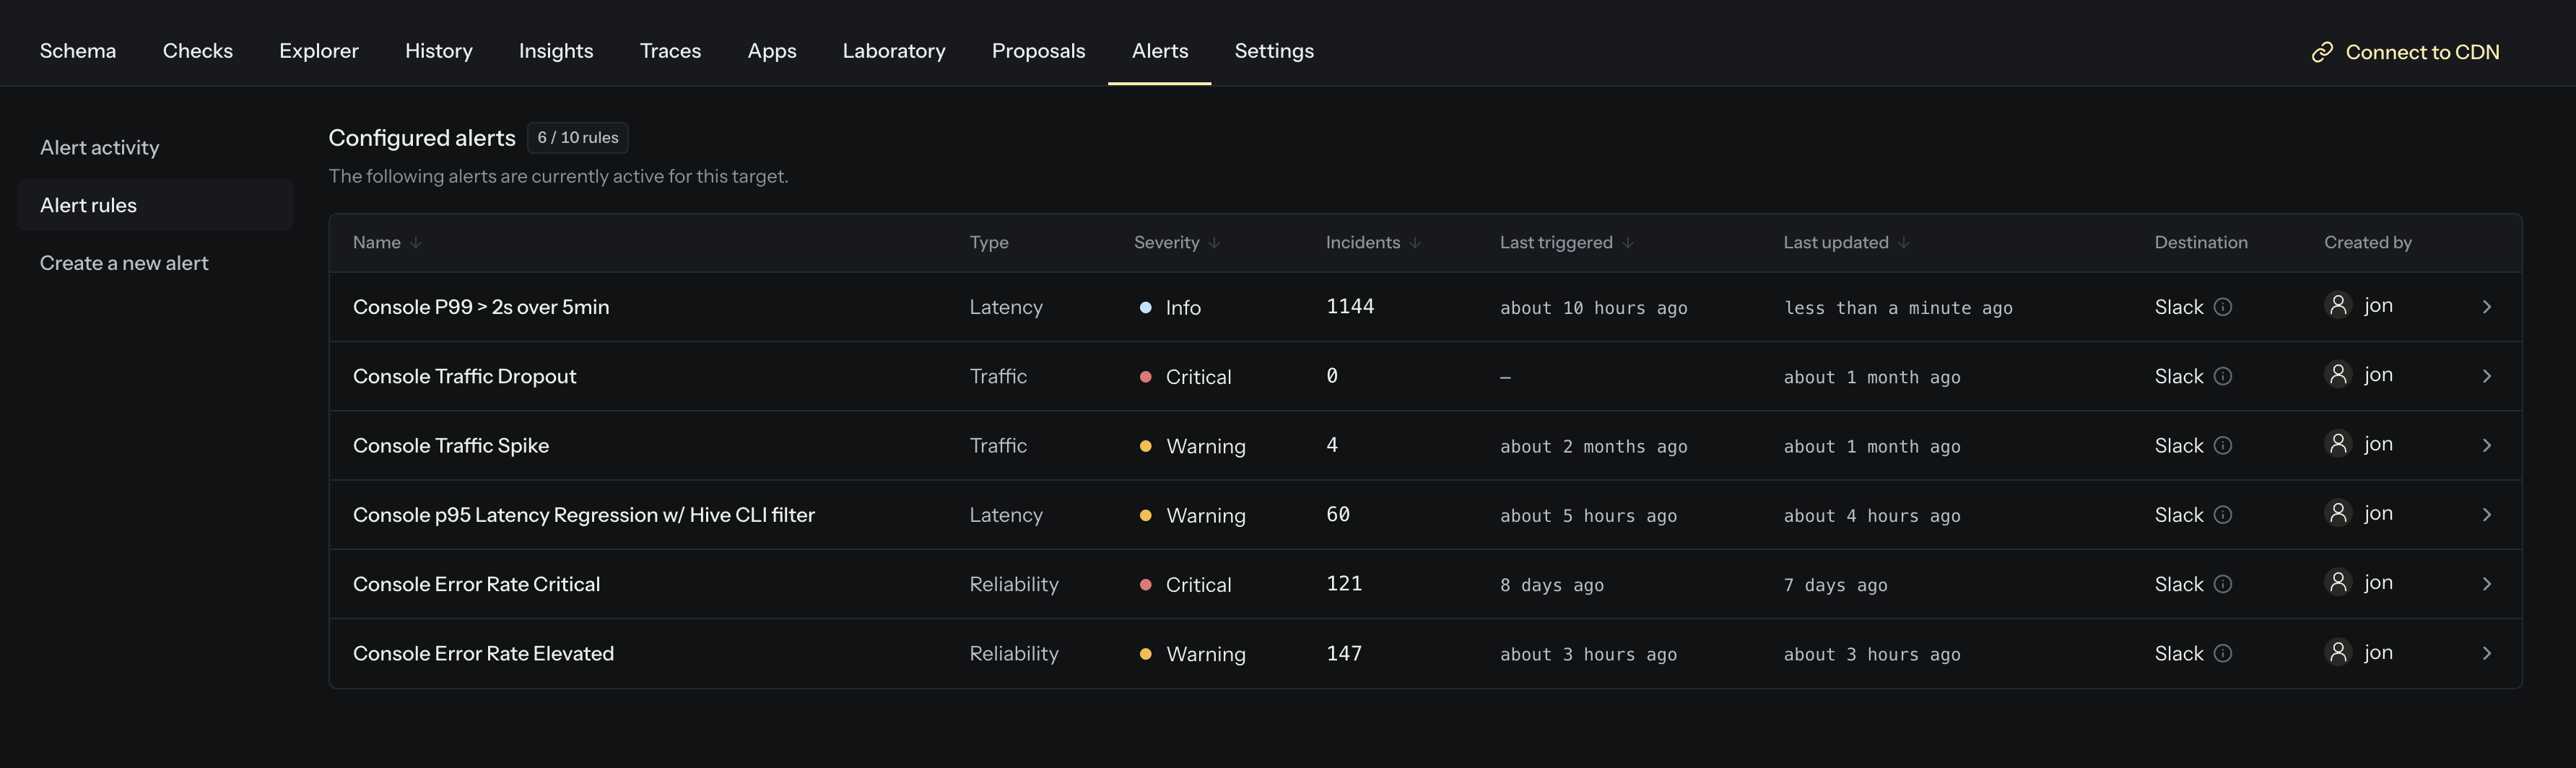
Each target can have up to 10 metric alert rules (enabled and paused rules both count toward the limit). You can pause a rule at any time to stop it from being evaluated without deleting it.
Creating an alert
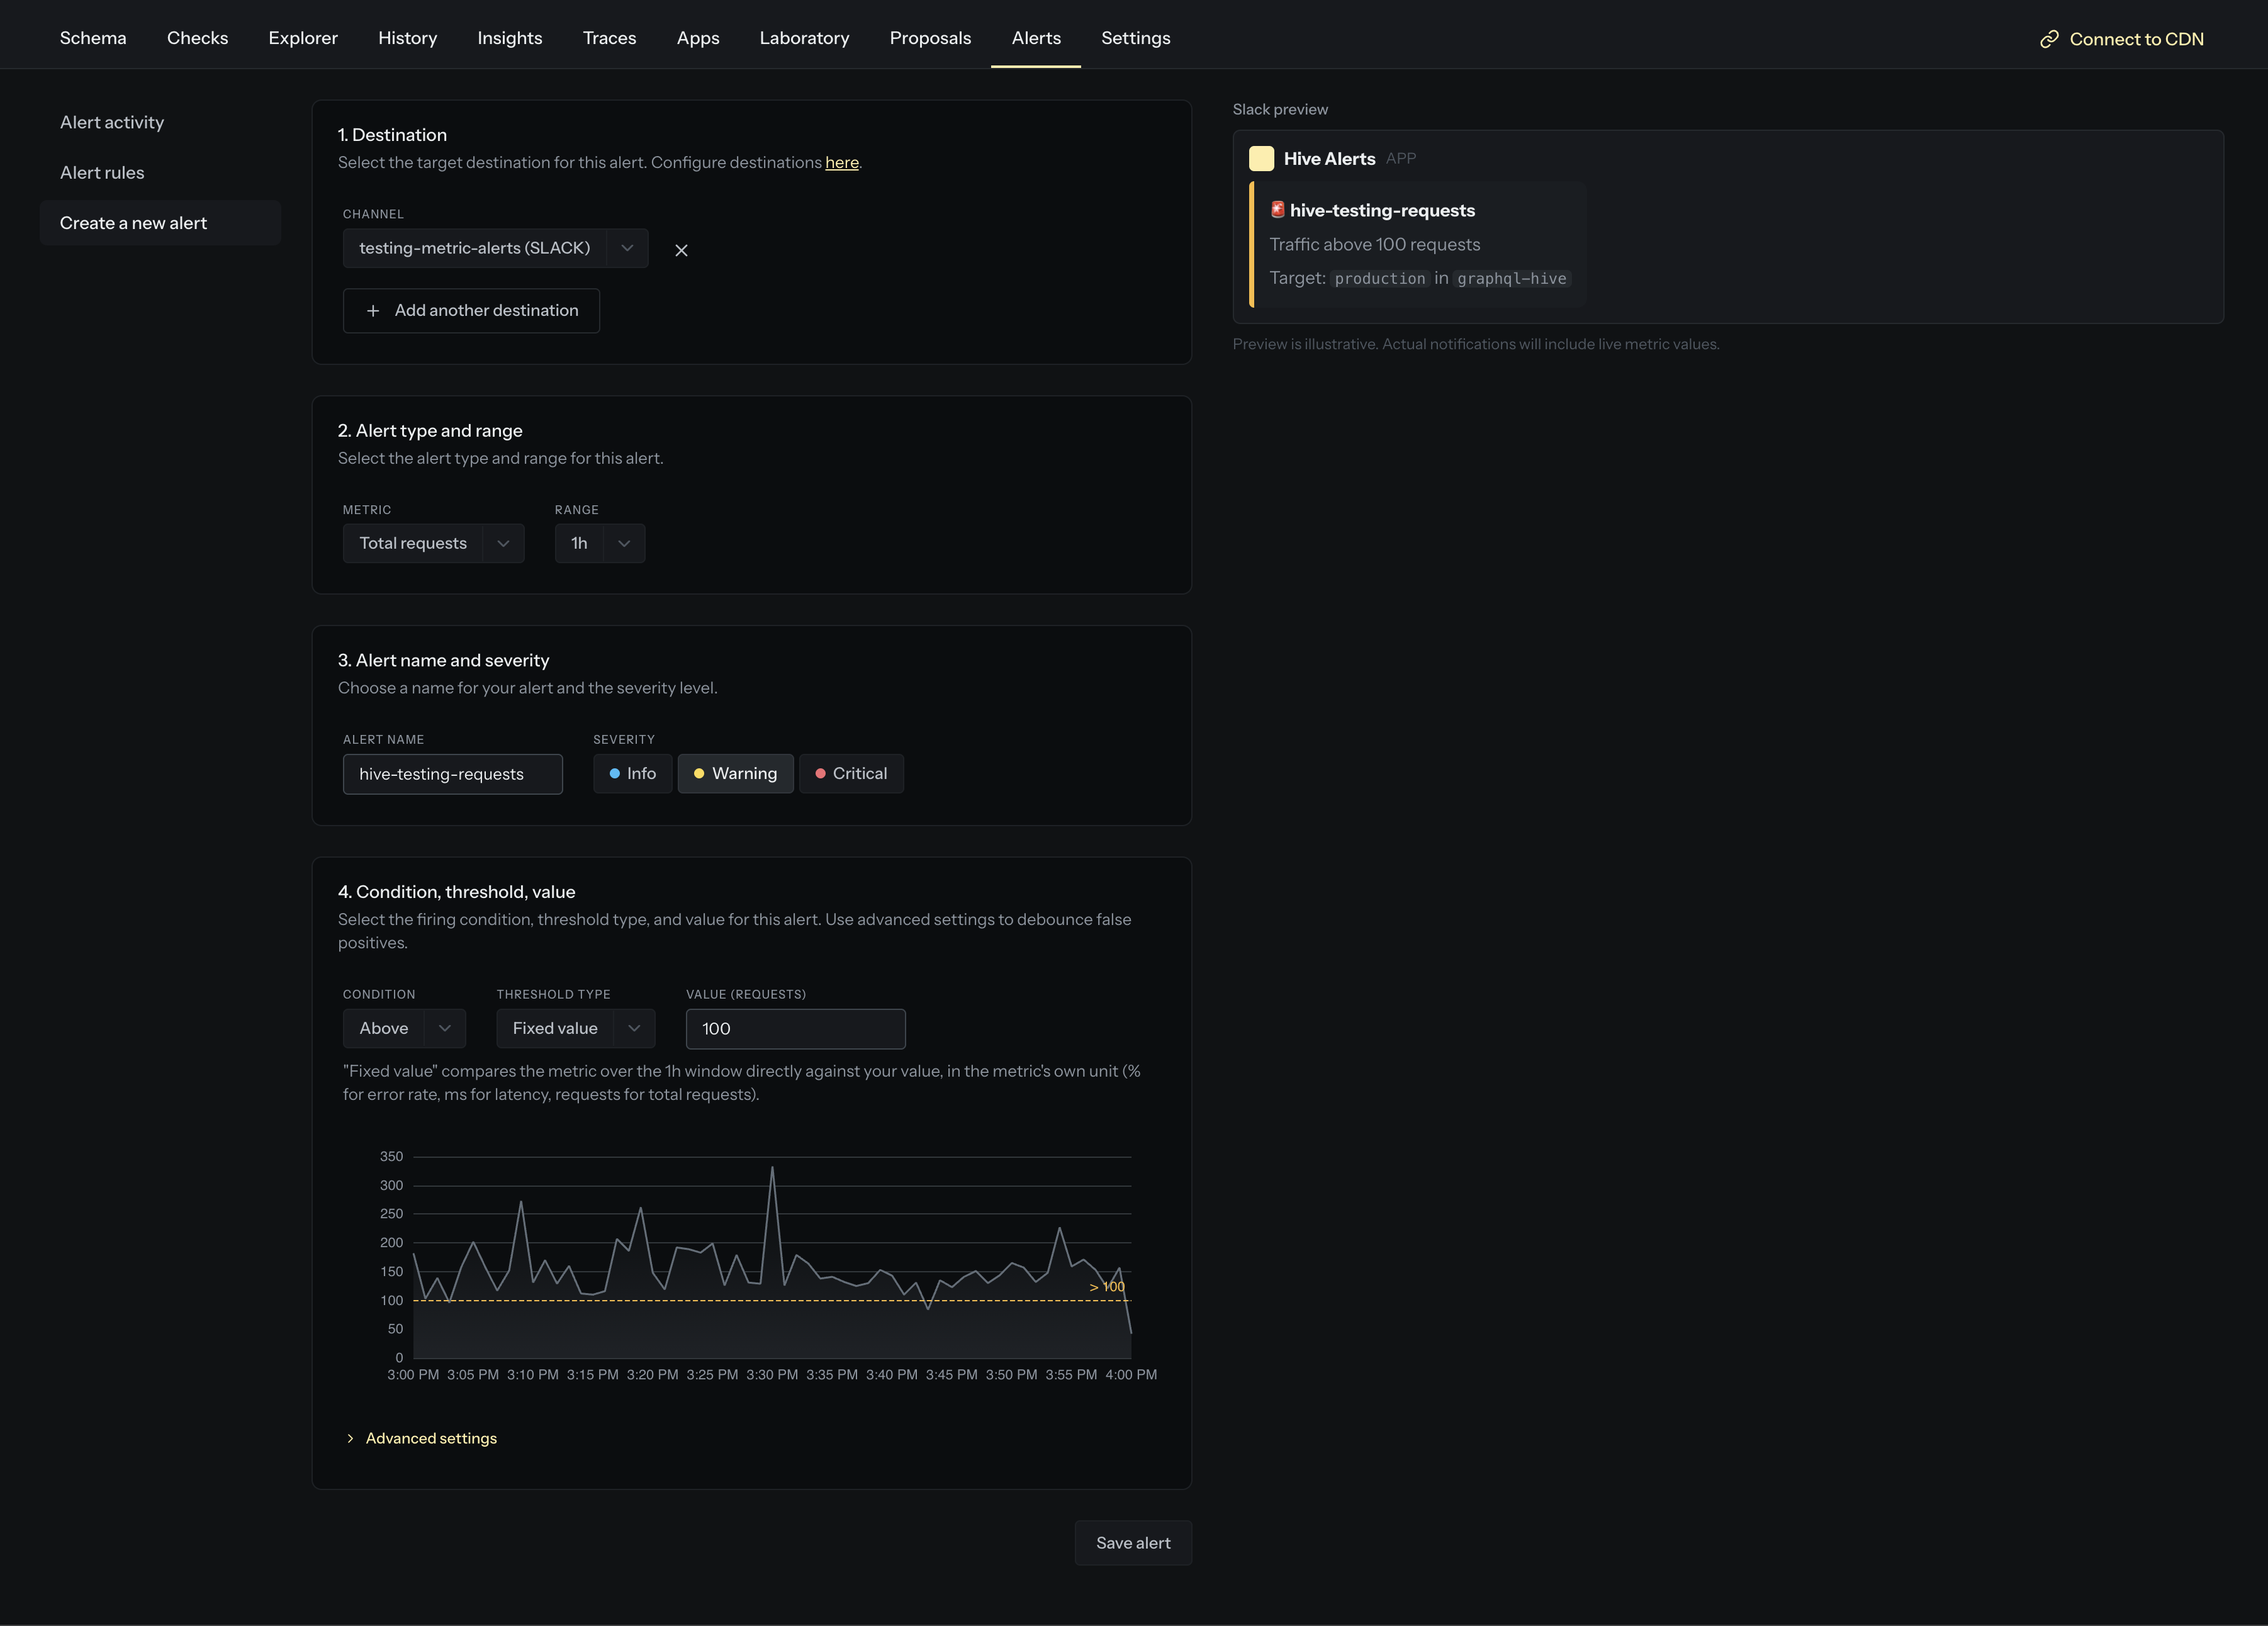
Click Create a new alert and fill in the four sections of the form.
1. Destination
Choose which alert channels receive the notification. You can add several destinations, or leave it empty to run the alert in test mode: it will still transition between states in the UI so you can validate the rule, but no notifications are sent.
2. Alert type and range
-
Metric, the metric to watch:
Metric What it measures Unit Total requestsNumber of operations in the window requests Error rateShare of operations that returned a GraphQL error % p75 latency75th-percentile operation latency ms p90 latency90th-percentile operation latency ms p95 latency95th-percentile operation latency ms p99 latency99th-percentile operation latency ms -
Range, the rolling window the metric is measured over. Available windows are 1, 2, 3, 5, 15, and 30 minutes, and 1 hour, 6 hours, 1 day, and 7 days. Shorter windows react faster and are evaluated more frequently; longer windows smooth out noise.
3. Alert name and severity
Give the rule a descriptive name and pick a severity: Info, Warning, or Critical. Severity is included in every notification and is used to filter the activity feed.
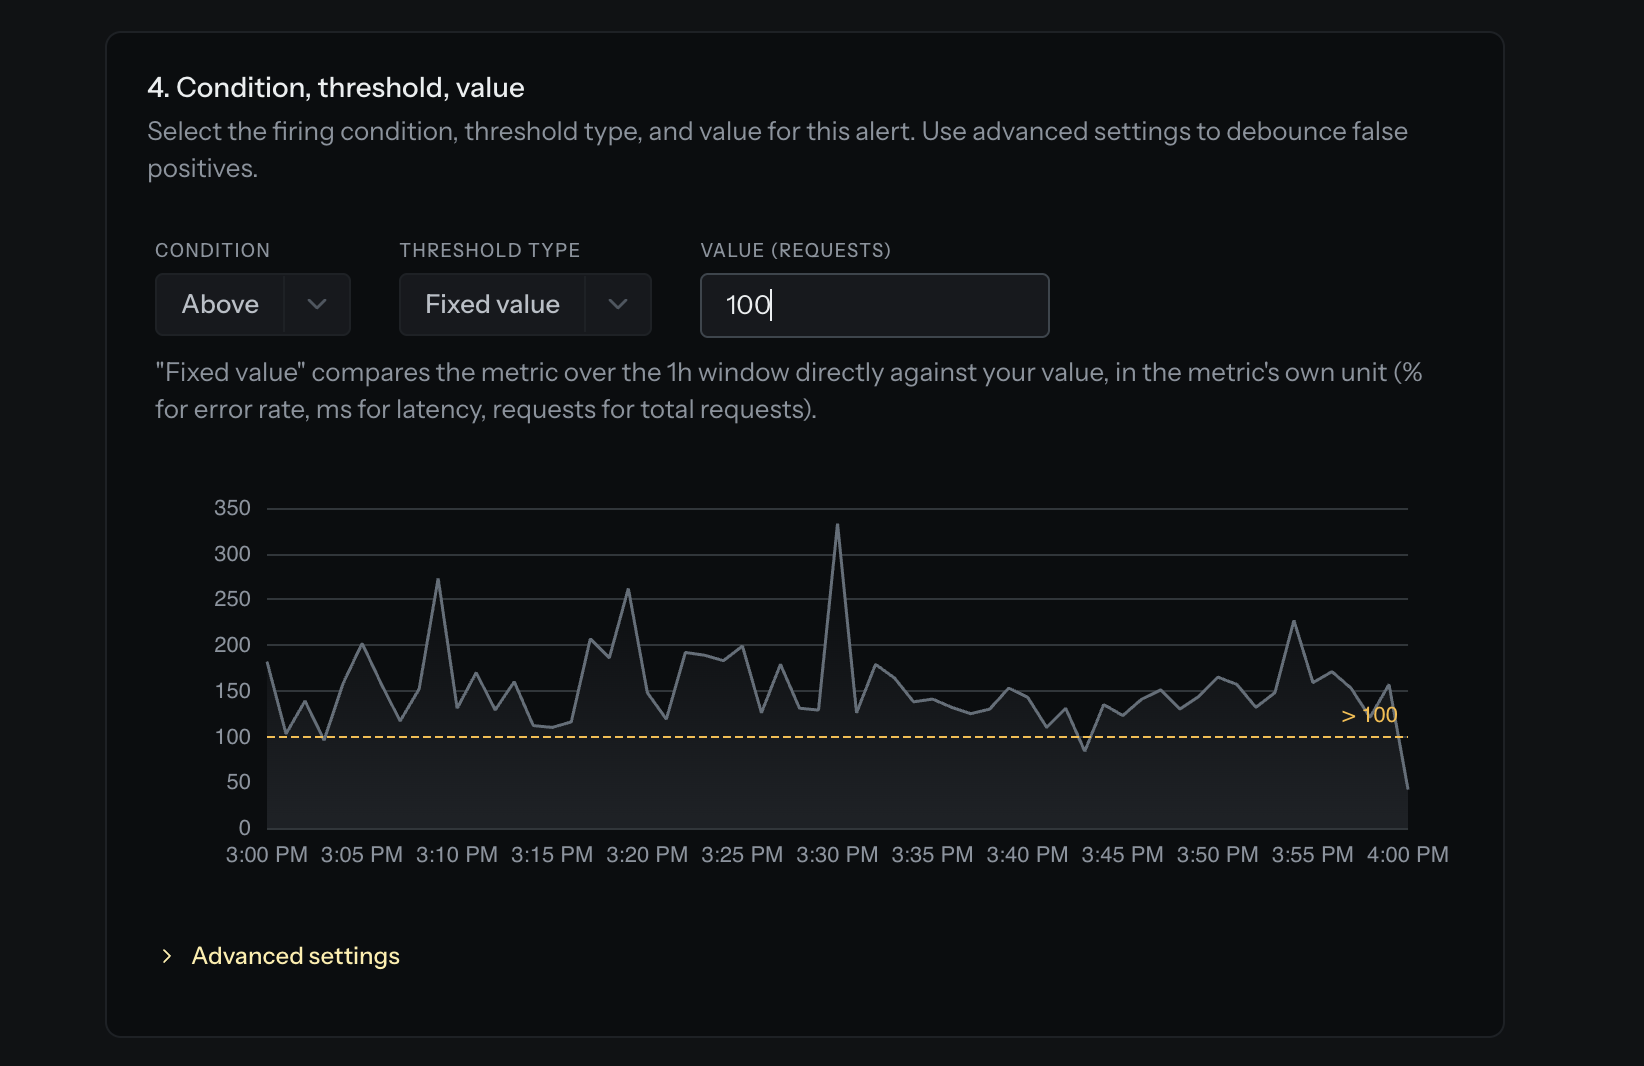
4. Condition, threshold, and value
-
Threshold type decides what the value is compared against:
- Fixed value: the metric over the window is compared directly to your value, in the metric’s own unit (ms, %, or requests). Use this for absolute limits such as “error rate above 5%”.
- % change vs. previous: the current window is compared to the immediately preceding window of the same length, and the rule fires on a percentage rise or fall. Use this to catch sudden swings such as “traffic dropped 50% compared to the previous hour”.
-
Condition sets the direction of a breach. For a fixed value it reads Above / Below; for a percentage change it reads Increase / Decrease.
-
Value is the threshold, entered in the unit shown next to the field.
Advanced settings
-
On filter: scope the rule to a subset of your traffic by attaching a saved Insights filter (for example, a specific set of operations or clients). The default is all operations.
-
Hold minutes: require the condition to hold continuously for N minutes before the rule fires. This debounces brief spikes and prevents false alarms. Leave it at
0to fire immediately.
Destinations and notifications
Metric alerts reuse the alert channels configured on the target’s project. The following channel types are supported:
- Slack
- MS Teams
- Webhook
To add or manage channels, configure them on the project. See Alert Channels. A single rule can send to multiple destinations, and the same channel can be used by many rules.
When a rule fires or recovers, Hive sends a message to each destination containing the alert name, type, severity, the current and previous metric values (with the percentage change), the threshold, and the target it applies to.
Webhook payload
Webhook destinations receive a POST request with a JSON body. The create form includes a live
preview of the exact payload and a Copy JSON Schema button. The payload has the following shape:
Limits
- Up to 10 metric alert rules per target (enabled and paused rules both count).
- Alert activity retention: 7 days (Hobby, Pro) or 30 days (Enterprise).