You will learn how ClickHouse and Kafka enabled GraphQL Hive to collect billions of requests monthly without a drop of sweat. We will also cover the challenges we faced and how we overcame them by covering Hive's architecture in detail.
What Is GraphQL Hive?
GraphQL Hive is a Schema Registry, Monitoring, and Analytics solution for GraphQL APIs. A fully open-source tool that helps you to track the history of changes prevents breaking the API and analyzing the traffic of your API.
GraphQL Hive makes you aware of how your GraphQL API is used and what is the experience of its final users.
We launched GraphQL Hive a few months ago, after a year-long preview program. In case you missed it, we recently announced a self-hosted version.
Monitoring Performance and Usage of GraphQL API
It is important to be aware of how a GraphQL API is used and what is the experience of its final users. To answer these questions GraphQL Hive collects Usage Reports. By looking at the sample below, you can get an idea of how GraphQL Hive knows when it's safe to delete a type or a field of your GraphQL API. This is the most important building block of all data available in GraphQL Hive.
{
  "size": 1,
  "map": {
    "762a45e3": {
      "operationName": "users",
      "operation": "query users { users { id } }",
      "fields": ["Query", "Query.users", "User", "User.id"]
    }
    /* ... */
  },
  "operations": [
    {
      "operationMapKey": "762a45e3", // points to the 'users' query
      "timestamp": 1663158676589,
      "execution": {
        "ok": true,
        "duration": 150000000, // 150ms in nanoseconds
        "errorsTotal": 0
      },
      "metadata": {
        "client": {
          "name": "demo", // Name of the GraphQL API consumer
          "version": "0.0.1" // Version of the GraphQL API consumer
        }
      }
    }
    /* ... */
  ]
}
Why ClickHouse?
The kind of data GraphQL Hive deals with is not meant to be mutated (it never changes) and the database has to support a good set of functions for analytics and data aggregation.
Our first choice was ElasticSearch. It seemed like a good option, but we hit the first scaling issues very quickly. After reaching the goal of 100M operations per month, the queries to ElasticSearch were unusable. We tried to improve it, but we weren't happy with ElasticSearch anyway.
After looking for alternatives we decided to switch to ClickHouse. We highly recommend reading the "100x Faster: GraphQL Hive migration from Elasticsearch to ClickHouse" article we wrote with the ClickHouse Cloud team. It covers in detail the problems we were facing and the decision-making process that lead us to love ClickHouse.
An Overview of the Architecture
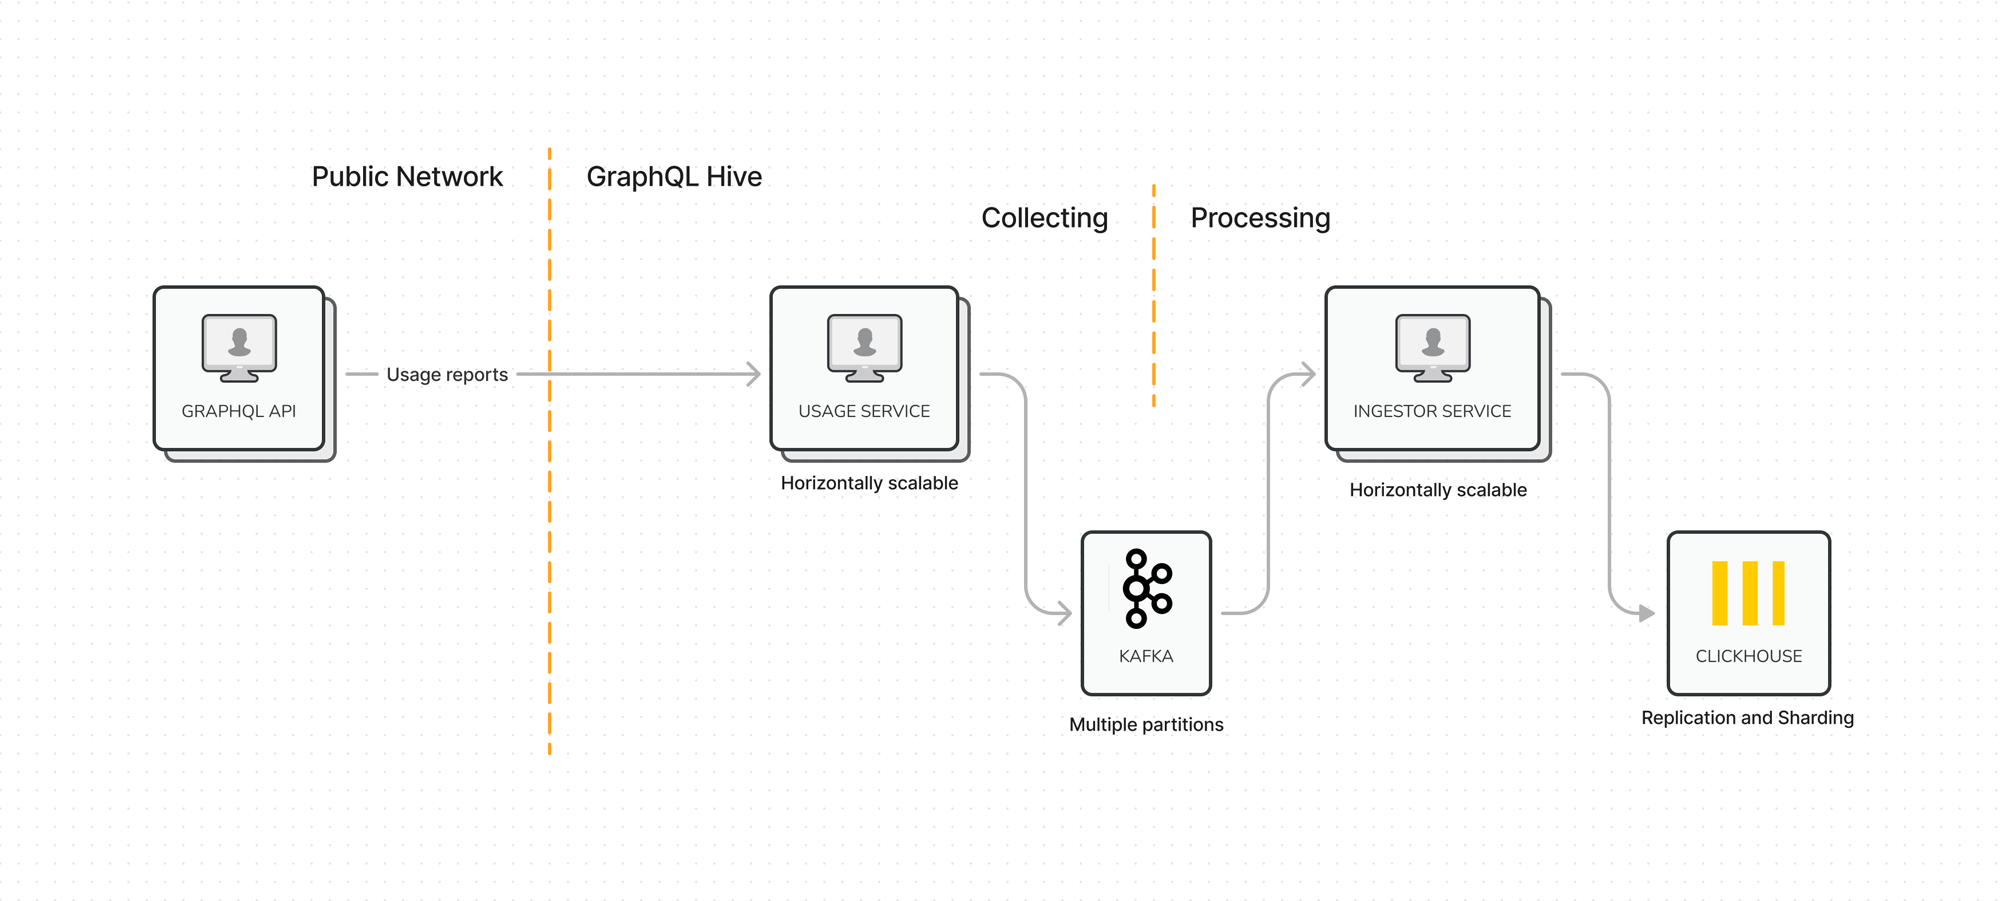
The data pipeline in GraphQL Hive is relatively simple but has proven to be highly scalable and reliable. Here's a high-level data flow of the usage reporting part of GraphQL Hive.

We can distinguish two parts here, the collecting and processing of data.
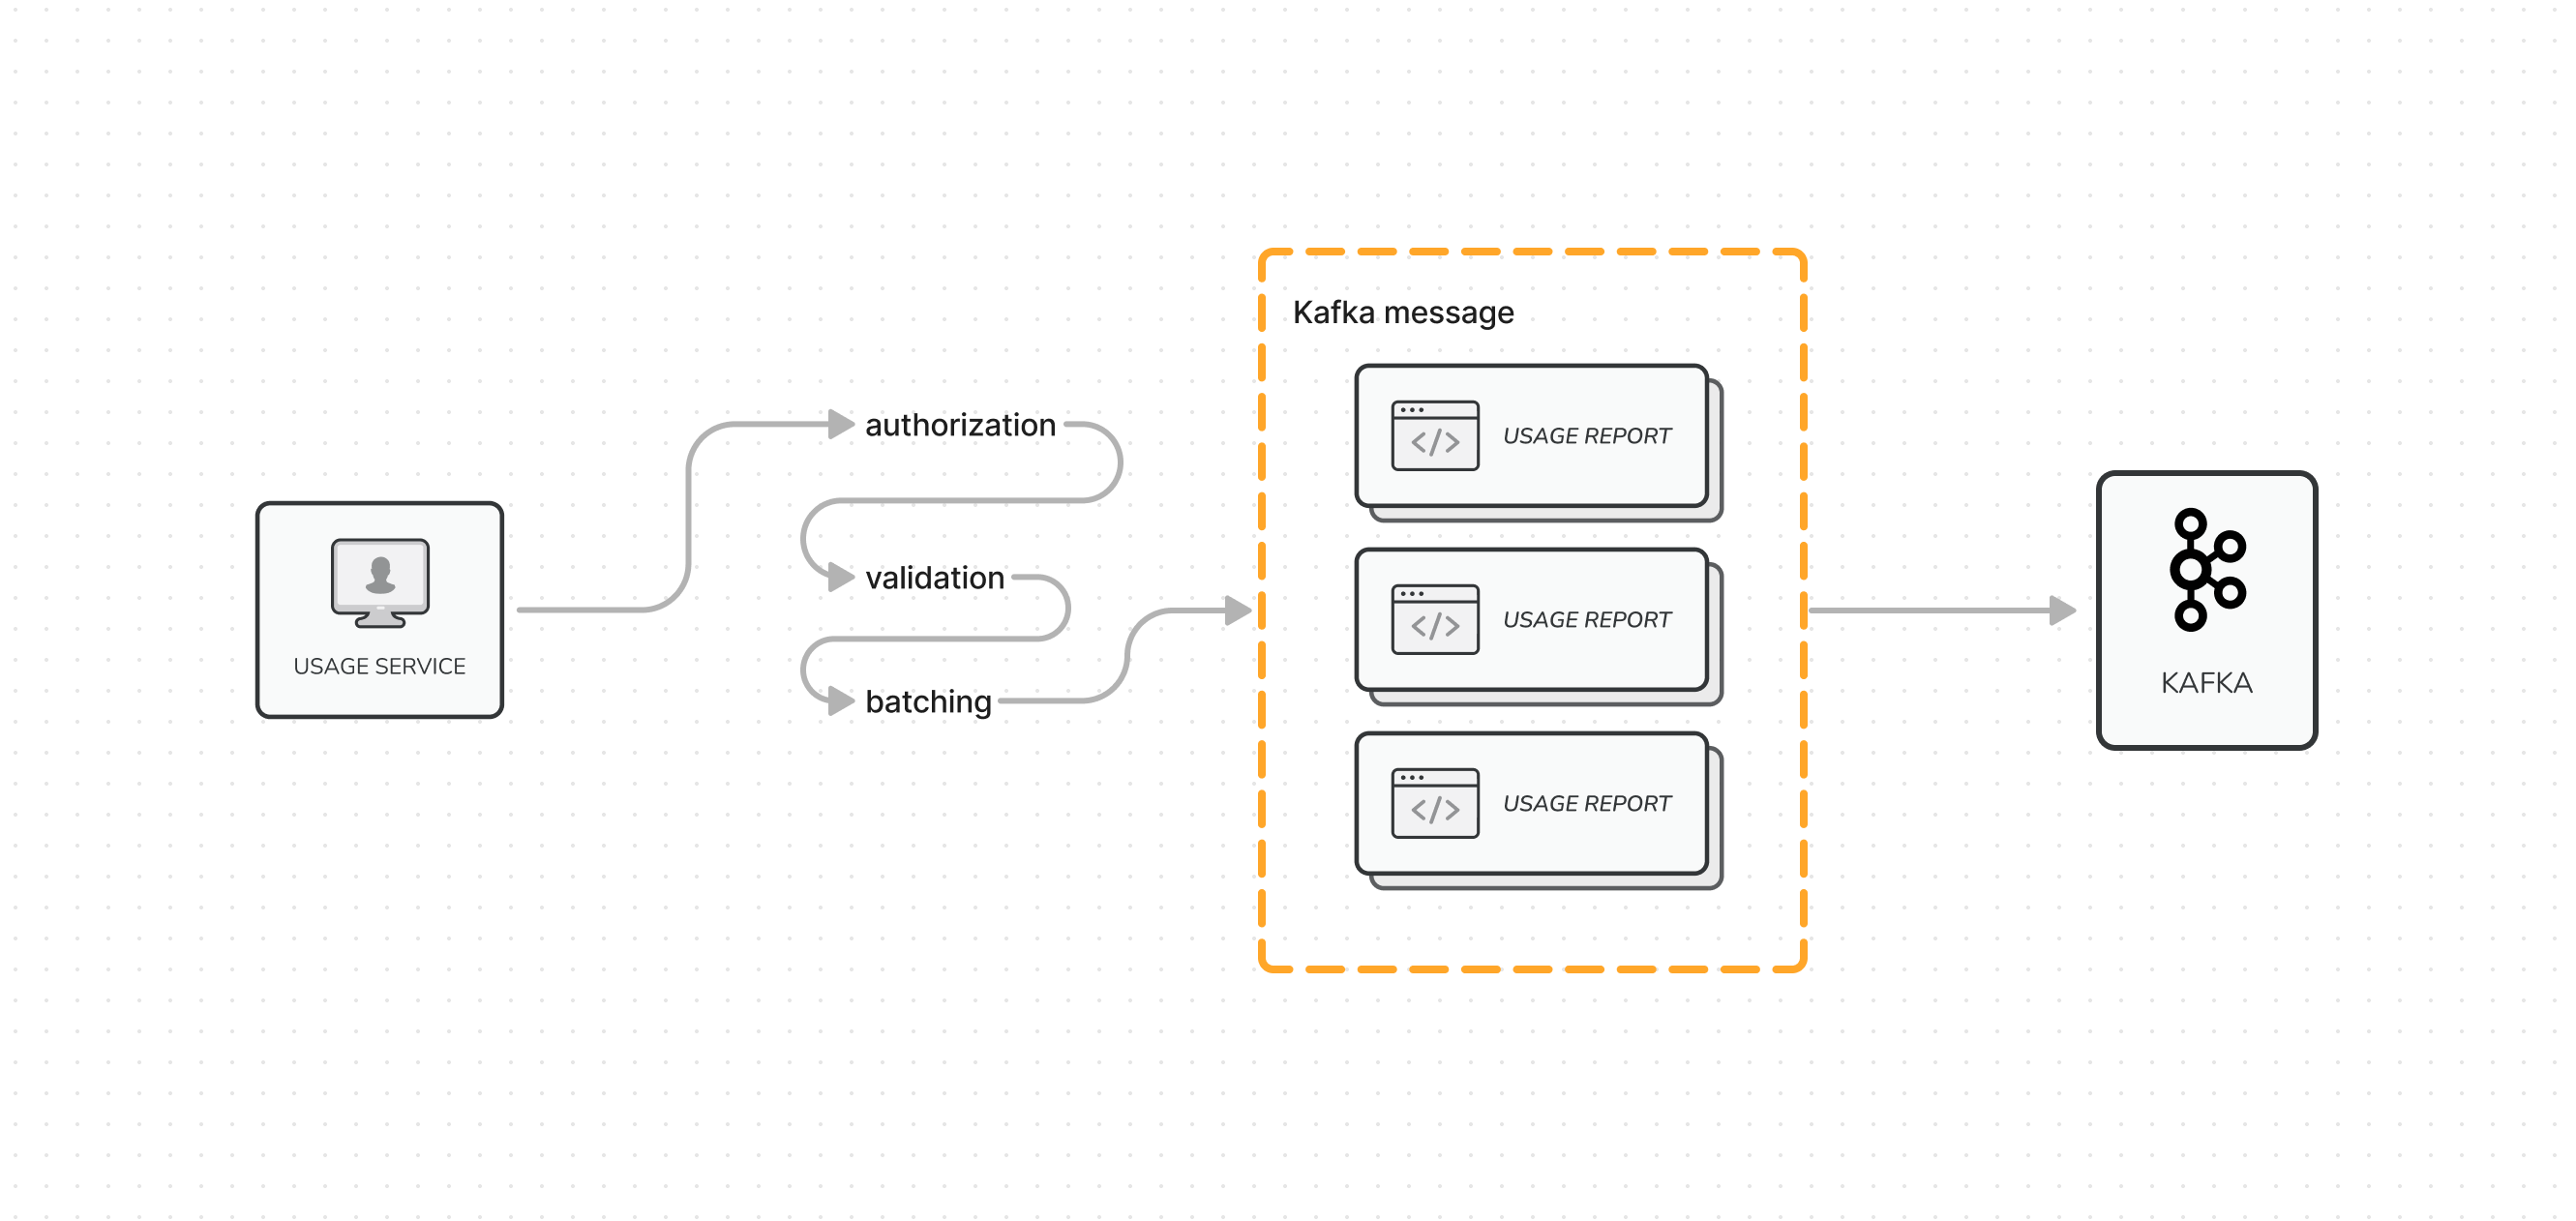
The Usage service is responsible for receiving and validating the usage report and of course the
token-based authorization. Once the report is validated, it is added to the batch of reports and
sent to Kafka (in one message).
Besides the batching we also perform a self-learning Kafka message size estimation.
In short, Kafka message has a limit of 1MB, with the size estimator, we make sure to not go over the limit but squeeze the most we can at a time. Instead of sending many small messages (~20kb), we send less often but almost at full capacity (on average about 998kb). It reduces the cost of the hosted Kafka by 10 times.
It sounds mysterious, but we find this part extremely interesting, that's why we're going to write a dedicated article about it soon.

Thanks to Kafka and its persistence of messages, the collecting and processing parts are nicely and reliably separated.
Now, let's take a look at the next piece of the puzzle.
The Usage Ingestor service receives the messages from Kafka, then it unpacks the usage reports from each message and processes them. Once the processing of reports is done, the service writes data to Clickhouse.

The data pipeline does not end here, there're still a few quite interesting techniques we use within ClickHouse.
ClickHouse supports Kafka natively, we could insert data directly from it, but the reason why we decided not to was to reduce the traffic to Kafka and have better control of the writes.
Squeezing the Most Performance
To understand the things we do with ClickHouse, you first need to understand the core of it, the MergeTree family and Materialized Views. This is what ClickHouse documentation says about the MergeTree family.
Table engines from the MergeTree family are the core of ClickHouse data storage capabilities. They provide most features for resilience and high-performance data retrieval: columnar storage, custom partitioning, sparse primary index, secondary data-skipping indexes, etc.
It sounds very technical, but you can think of the MergeTree family as a group of table engines built for a different purposes, dedicated to many different use cases.
We will cover only the regular MergeTree and SummingMergeTree.
Think of MergeTree table engine as a regular table, the one you're familiar with from PostgreSQL.
Nothing special here.
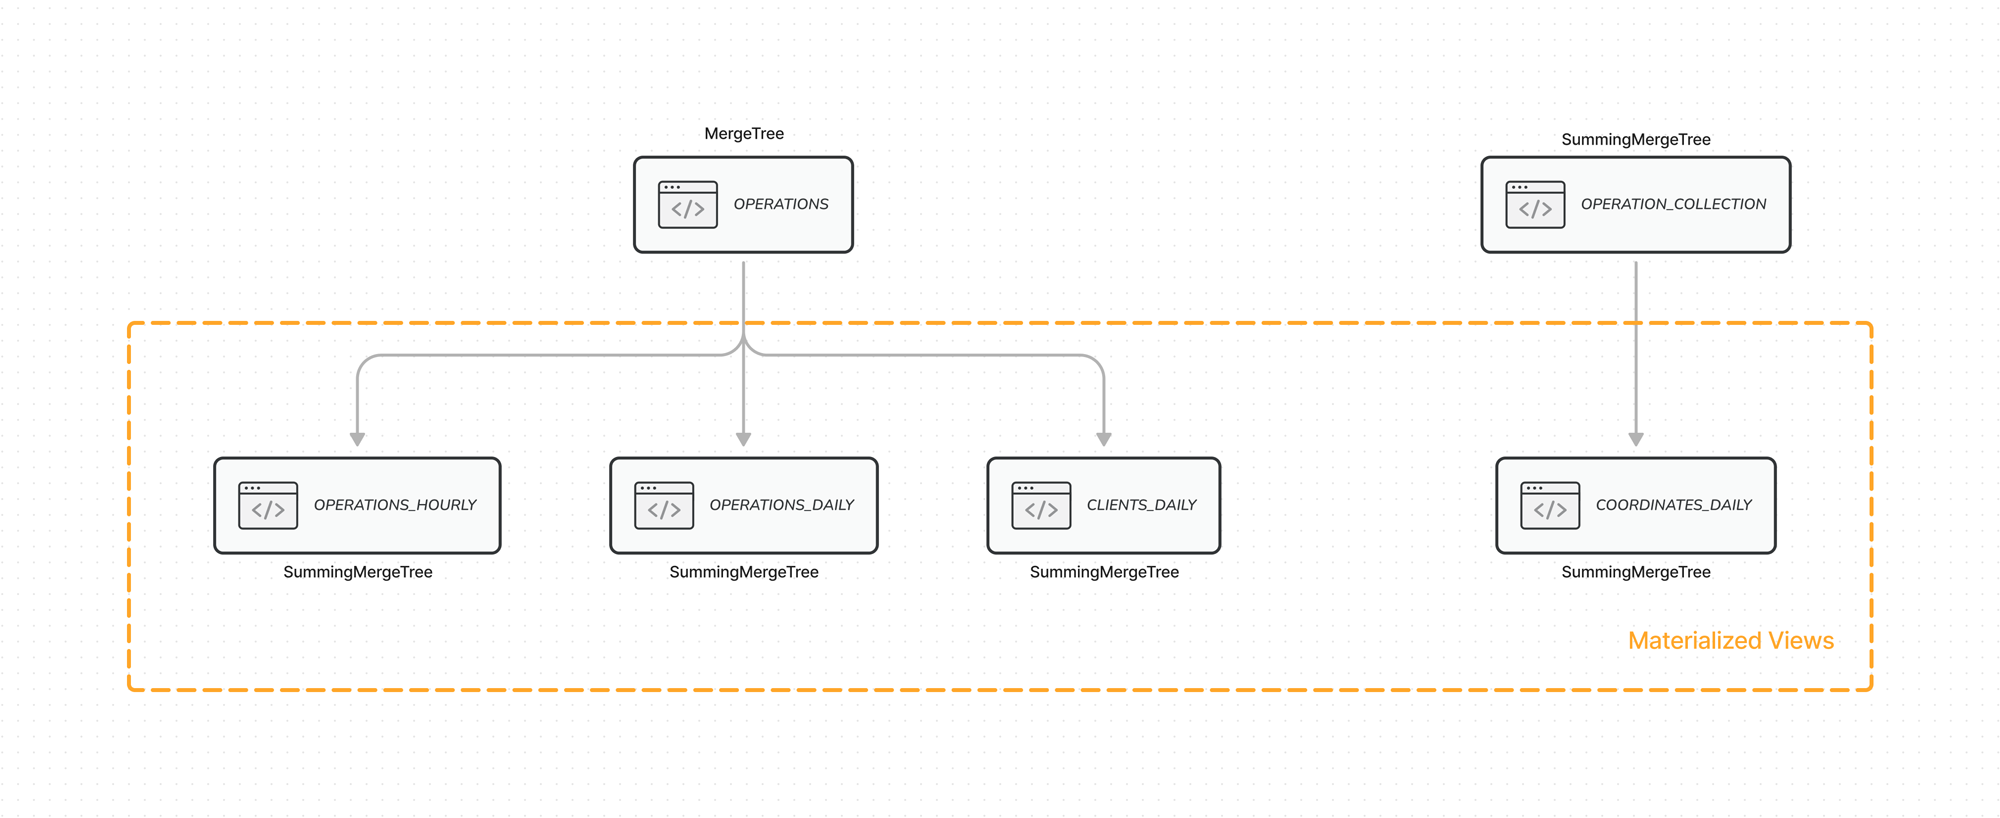
An overview of our ClickHouse tables.

In GraphQL Hive, we use MergeTree to store received GraphQL requests in the
operations table.
CREATE TABLE 'operations' (
  target STRING,
  timestamp DateTime ('UTC'),
  expires_at DateTime ('UTC'),
  hash STRING,
  ok UInt8,
  errors UInt16,
  duration UInt64,
  client_name STRING,
  client_version STRING
)
Every GraphQL request from the collected billions of requests monthly is represented by a row in the
operations table.
Even though ClickHouse is extremely fast, it's still quite a lot of rows to read and analyze data from, every second.
That's why we use the SummingMergeTree. It is a bit unique version of MergeTree.
In short, it replaced all rows (grouped by a combination of columns) with one row which contains summarized values for the columns.
Sounds like a good table engine for grouping GraphQL operations and aggregating data! We use it in
the
operation_collection table.
It allows us to read all GraphQL operations within milliseconds and get the total number of calls.
Without the SummingMergeTree we would have to either maintain our own aggregation logic and write
data to the MergeTree table or always scan through billions of rows of the operations table.
We are not data scientists, at least not yet… but what we learned by developing GraphQL Hive is that in order to squeeze the most performance of a database, you need to design the DB structure with the end goal in mind.
What do we mean by that? Here's a good example.
GraphQL Hive has the "Operations" page that presents the total number of requests, latency (p90, p95, p99) of all and individual operations, and a lot more other things.
The page contains a date range filter.

Calculating the percentiles of the latency for a large number of GraphQL requests (stored as rows) might be a challenge, even for ClickHouse. Maybe not for "Last 24 hours" as we get only 1/30 of all rows, compared to the "Last 30 days" option. Obviously, it won't be performant enough at some point.
Here's where the Materialized Views become super handy. GraphQL Hive defines two "virtual" tables,
operations_hourly
and
operations_daily
that are Materialized Views of the original operations table.
In short, the operations_hourly stores summarized data of all GraphQL requests that happen during
an hour. It allows us to store one row per hour instead of millions. How much impact it has on
ClickHouse performance? For a 24h window, ClickHouse needs to read only 24 rows instead of 100s of
millions.
Thanks to Materialized Views, the latency of our queries went from 4-10 seconds to less than 1 second.
You can see how SummingMergeTree and Materialized Views are crucial to ClickHouse performance.
As you know, GraphQL Hive is open source and built in public, which means you can watch our journey and learn from our mistakes. Here's an excellent example of what we mean, it's an issue where we discussed the new data structure of ClickHouse. It shows the latency of the existing queries and how we improved it.
Here's yet another, this time extreme example of a table designed with an end goal in mind.

GraphQL Hive allows you to understand who are the consumers of your GraphQL API.
Here's the SQL query that we previously used to generate the charts:
SELECT
  COUNT(*) AS total,
  client_name,
  client_version
FROM
  operations
WHERE
  timestamp >= subtractDays (now(), 30)
GROUP BY
  client_name,
  client_version
The latency was awfully slow, the more data we had, the slower it was. For a few billion rows, it took 56 seconds, a ridiculously poor performance.
We decided to create a special materialized view, designed specifically for the UI component.
CREATE MATERIALIZED VIEW 'clients_daily' (
  target STRING,
  client_name STRING,
  client_version STRING,
  hash STRING,
  timestamp DateTime ('UTC'),
  expires_at DateTime ('UTC'),
  total UInt32
)
Here's a full SQL definition of that table.
Now the SQL query looks like this:
SELECT
  sum(total) AS total,
  client_name,
  client_version
FROM
  clients_daily
WHERE
  timestamp >= subtractDays (now(), 30)
GROUP BY
  client_name,
  client_version
After we shipped a dedicated table (for the component we showed you), the numbers went down from 56 seconds to 56 milliseconds.
It was a 1000x improvement.
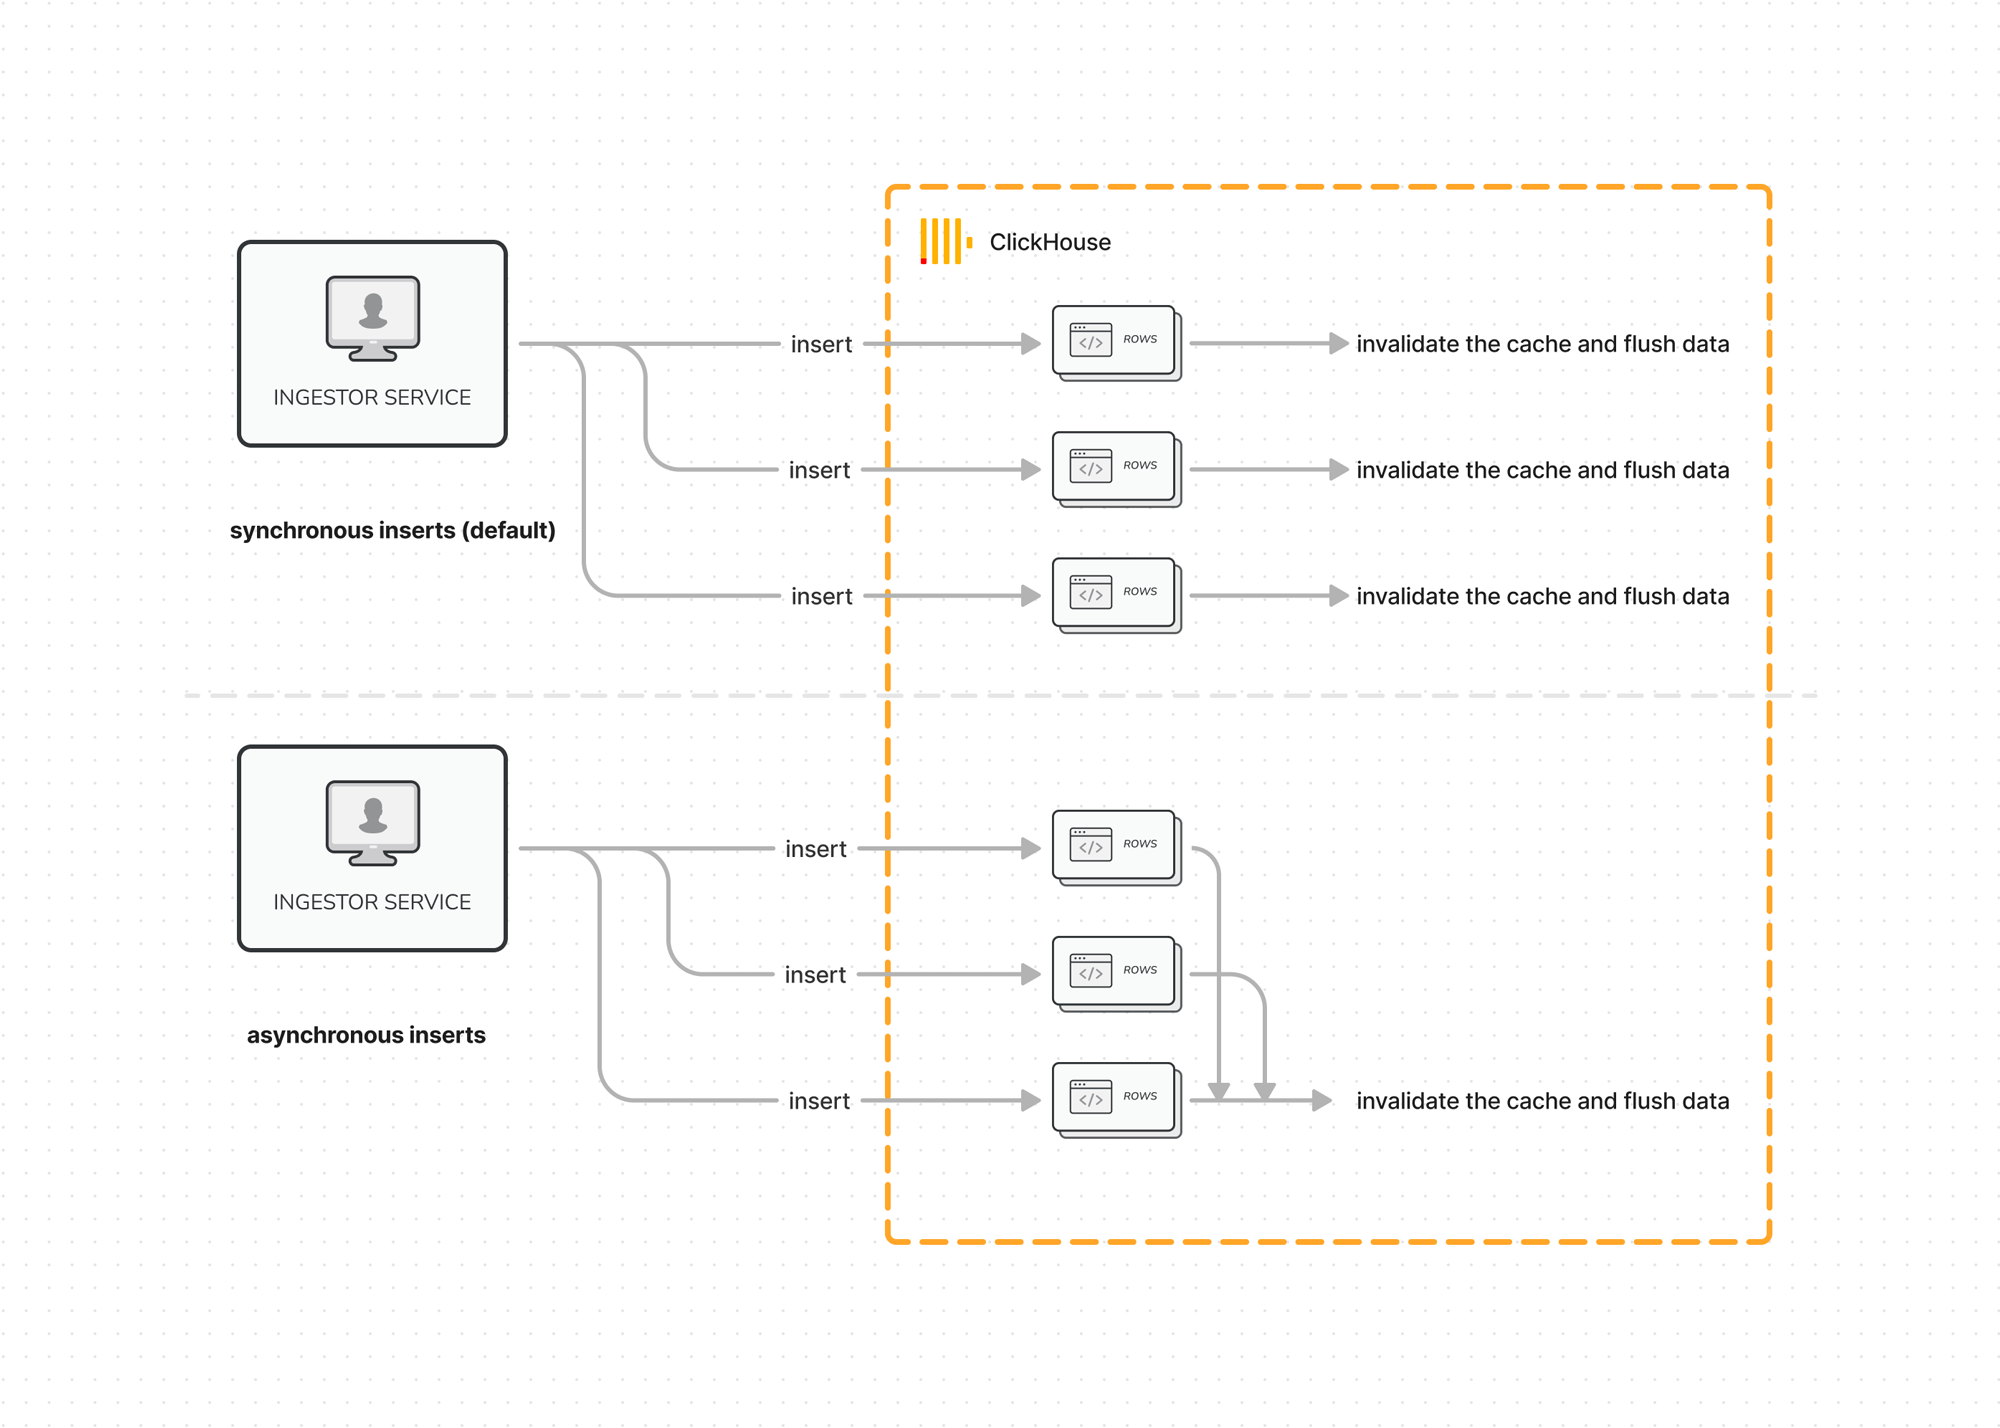
Another fantastic feature of ClickHouse is Asynchronous Inserts. This opt-in mode allows to pile up inserted data and flush it in a single batch. Thanks to the async inserts we're able to accept a higher rate of INSERT queries, without worrying about the performance.

Every read operation in ClickHouse is being cached, writing too often translates to a lot of cache misses. To avoid that, we either use the async inserts mode or synchronously write data less often but in higher volumes. We decided to use the async inserts mode, as it's a built-in feature and makes our setup less complex.
Conclusion
We did many, many mistakes, and we still do, but what we learned by working on GraphQL Hive and a large set of data is that the end goal should dictate the shape of data and tables.
You can use the fastest database on earth and still experience poor performance.
Our advice is also to not think too much ahead of time, you can always iterate and improve your setup as you scale up. There's really no need to overcomplicate things just for the sake of making it "highly scalable". We think it's better to make mistakes and learn from them, instead of copying the architecture of Cloudflare and other big tech companies.
If you find this article interesting, please let us know and tell us what else you wish to learn about. We're going to write a couple of articles about technical bits and pieces of GraphQL Hive in the upcoming weeks, so stay tuned!
